In 2026, Disney+ has 131.6 million subscribers, an increase of over 6 million in just one year. Around 30% of these users are on the ad-supported tier.
Disney Plus revenue also saw a boost, hitting $2.82 billion in Q1 2025 and reaching $10.4 billion for all of 2024, a 23.81% increase compared to the previous year.
This article covers the latest facts and figures about Disney Plus users, usage, revenue, and content.
Disney Plus Subscribers — Top Picks
- Disney Plus has 131.6 million subscribers worldwide.
- The platform gained 6.3 million subscribers in 2025, compared to the end of 2024.
- Disney+ generated an average revenue per user of $8.04.
- About 30% of Disney+ subscribers use the ad-supported tier.
- Disney+ earned $2.82 billion in revenue in Q1 2025.
- It is the fourth most popular SVOD platform, with a 12% market share.
How Many Subscribers Does Disney Plus Have?
There are 131.6 million Disney Plus subscribers worldwide as of Q4 2025.
This marks an increase of about 5% from the 125.3 million users reported in Q4 2024.
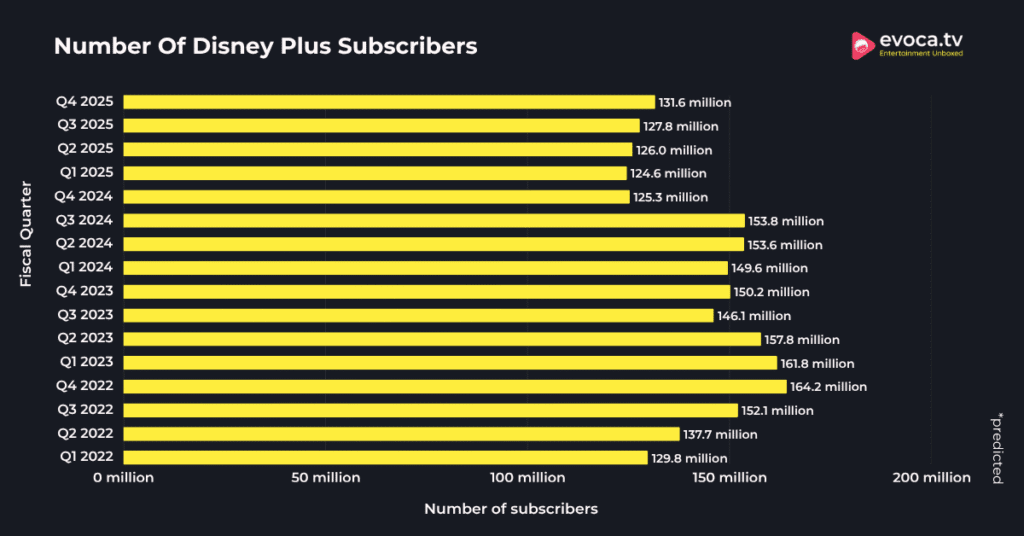
The following table displays the total number of Disney+ subscribers recorded over the past quarters.
| Fiscal Quarter | Disney Plus Number of Subscribers |
|---|---|
| Q4 2025 | 131.6 million |
| Q3 2025 | 127.8 million |
| Q2 2025 | 126 million |
| Q1 2025 | 124.6 million |
| Q4 2024 | 125.3 million |
| Q3 2024 | 153.8 million |
| Q2 2024 | 153.6 million |
| Q1 2024 | 149.6 million |
| Q4 2023 | 150.2 million |
| Q3 2023 | 146.1 million |
| Q2 2023 | 157.8 million |
| Q1 2023 | 161.8 million |
| Q4 2022 | 164.2 million |
| Q3 2022 | 152.1 million |
| Q2 2022 | 137.7 million |
| Q1 2022 | 129.8 million |
With the recent Disney Plus subscriber count showing inconsistent trends, new Disney Plus revenue reports, and performance can be expected to be on the same lines.
Note: Disney has updated its way of reporting subscriber numbers. Previously, Disney+ subscribers in Southeast Asia were counted under Disney+ Hotstar. However, Disney has now adjusted its data to include these subscribers under Disney+ instead.
Additionally, Disney+ Hotstar is no longer reported as a separate entity, as it was part of the Star India Transaction, a deal in which Disney sold its controlling stake in Star India to Reliance Industries.
Source: Statista, Disney Investor Relations.
Share of Disney+ Subscribers By Plan Tier
Around 30% of Disney+ subscribers worldwide (excluding Disney+ Hotstar users in India) are subscribed to the ad-supported tier.
This equates to approximately 36.8 million subscribers who choose the more affordable option that includes ads. This growing preference for the ad-supported model reflects a shift in how users are engaging with streaming services, balancing cost savings with occasional ads.
Source: eMarketer
Disney Plus ARPU
Disney+’s overall ARPU (average revenue per user) rose from $7.20 in Q4 2024 to $8.04 in Q4 2025.
This increase reflects better performance in both domestic and international markets, meaning Disney+ is successfully boosting revenue from its subscribers worldwide.
In the U.S. and Canada, the ARPU went up from $7.70 in Q4 2024 to $8.09 in Q4 2025, showing a positive trend. Similarly, internationally, ARPU grew from $6.78 in Q4 2024 to $8 in Q4 2025, reflecting a solid improvement as well.
The following table displays Disney+’s ARPU (average revenue per user) by region:
| Region | Q4 2025 | Q4 2024 |
|---|---|---|
| Domestic (U.S. and Canada) | $8.09 | $7.70 |
| International | $8.00 | $6.78 |
| Overall Disney+ | $8.04 | $7.20 |
Source: Disney Investor Relations
Disney Plus User Demographics
15.2% of the Disney Plus users in the United States are aged 0 to 11 years.
The majority of Disney Plus users are aged 25 to 34 years, and 19.2% of the users are aged 35 to 44 years.
On the other hand, just 4.7% of Disney users are over 65 years old.
The following table displays the share of Disney Plus users by age group.
| Age Group | Share of Disney Plus Users |
|---|---|
| 0 to 11 years | 15.2% |
| 12 to 17 years | 10.3% |
| 18 to 24 years | 16.7% |
| 25 to 34 years | 24.7% |
| 35 to 44 years | 19.2% |
| 45 to 54 years | 11.9% |
| 55 to 64 years | 7.0% |
| 65 and over | 4.7% |
Source: eMarketer
Disney Plus Downloads
Disney+ app downloads in Q3 2024 stood at 4.49 million in the United States.
This represents a slight increase from Q2 2024, which had 3.86 million downloads, but it remains lower than the figures observed in previous months.
The highest number of downloads occurred in Q1 2022, with 8.51 million, followed by 7.69 million in Q4 2022. Since those peak periods, downloads have been on a steady decline, with numbers gradually decreasing from 2022 through 2024.
The following table displays the number of Disney Plus downloads recorded over the quarters.
| Quarter | Downloads |
|---|---|
| 2024 Q3 | 4.49 million |
| 2024 Q2 | 3.86 million |
| 2024 Q1 | 4.26 million |
| 2023 Q4 | 4.82 million |
| 2023 Q3 | 4.39 million |
| 2023 Q2 | 4.51 million |
| 2023 Q1 | 5.43 million |
| 2022 Q4 | 7.69 million |
| 2022 Q3 | 7.22 million |
| 2022 Q2 | 7.35 million |
| 2022 Q1 | 8.51 million |
| 2021 Q4 | 7.9 million |
| 2021 Q3 | 8.9 million |
Source: Statista
Disney+ Subscriber Retention Rate
Over two-thirds of the Disney Plus subscribers retain their subscriptions after 6 months.
On average, 68% of Disney Plus subscribers retain their services after 6 months of subscribing to the platform.
Among 62% of the monthly subscribers of the Disney Plus plan who do not have access to Hulu and ESPN+ continue to pay for the services even after 6 months.
On the other hand, Netflix has a retention rate of 72%, while Hulu has a retention rate of 65%
Source: Second Measure
Disney Plus Viewership
By 2026, the number of ad-supported viewers for Disney Plus in the United States is estimated to reach 152.8 million.
Similarly, in 2025, the number of ad-supported viewers on the platform reached 145.2 million.
Meanwhile, this number was recorded to be 109.8 million in 2022.
Here is a table displaying the number of viewers on its ad-supported tier over the years.
| Year | Number of Disney Plus Viewers on Ad-supported Plan |
|---|---|
| 2026* | 152.8 million |
| 2025 | 145.2 million |
| 2024 | 134 million |
| 2023 | 122 million |
| 2022 | 109.8 million |
*- Estimated Values
Source: Statista.
11% of the consumers watched Disney Plus daily.
7% of the male and 7% of the female users stated that they used Disney Plus services daily.
On the contrary, 57% of the male users and 54% of the female users stated that they had never used the streaming services of Disney Plus.
Meanwhile, 14% of the male users and 12% of the female users stated that they used Disney Plus a few times per week.
The following table displays the share of Disney Plus users according to their usage frequency.
| Frequency | Male Users | Female Users |
|---|---|---|
| Multiple times a day | 7% | 7% |
| Once daily | 6% | 4% |
| A few times per week | 14% | 12% |
| Once per week | 8% | 6% |
| A few times | 6% | 12% |
| Once | 5% | 4% |
| Never | 57% | 54% |
Source: Statista.
Disney Plus Revenue
Disney Plus revenue reached $2.82 billion in Q1 of fiscal year 2025.
Meanwhile, in 2024, Disney+ earned $10.4 billion, marking a 23.81% increase from $8.4 billion in 2023.
Overall, Disney Plus’s revenue has shown consistent growth from 2020 to 2025, with the most significant jumps happening in the past couple of years, reflecting the platform’s success in attracting more subscribers and increasing monetization strategies.

The following table displays the Disney Plus revenue reported over the past years till the latest revenue release.
| Year | Disney Plus Revenue |
|---|---|
| 2025 (Q1) | $2.82 billion |
| 2024 | $10.4 billion |
| 2023 | $8.4 billion |
| 2022 | $7.4 billion |
| 2021 | $5.2 billion |
| 2020 | $2.8 billion |
Source: Business of Apps.
Disney Plus Market Share
Disney+ ranks as the fourth most popular SVOD platform, holding a 12% market share.
Meanwhile, Amazon Prime Video leads the SVOD market as the most popular, with a 22% market share.
Other major players in the SVOD market include Netflix, Max, Hulu, and Paramount Plus.

Here is a table displaying the market share of the SVOD platform recorded in Q1 2024.
| SVOD Platform | Market Share Of The Platform |
|---|---|
| Amazon Prime Video | 22% |
| Netflix | 21% |
| Max | 13% |
| Disney+ | 12% |
| Hulu | 10% |
| Paramount+ | 9% |
| Apple TV+ | 8% |
| Peacock | 1% |
| Other | 4% |
Source: Statista.
Disney Plus Content Statistics
Disney Plus is anticipated to spend $25 billion on its content.
In fiscal year 2023, Disney Plus spent around $27 billion on original and acquired content. That was a decrease of nearly 2 billion compared to the previous year.
However, due to overall cost savings amid the strikes and continuous losses in businesses, content spending on Disney Plus is anticipated to decrease further by 2 billion compared to that spent in 2023.
The following table displays the spending on content by Disney recorded over the past years.
| Fiscal Year | Disney’s Content Spending |
|---|---|
| 2024 | 25 billion |
| 2023 | 27.2 billion |
| 2022 | 29.9 billion |
| 2021 | 25.3 billion |
| 2020 | 20.2 billion |
| 2019 | 17.6 billion |
*- Predicted value.
Source: Statista.
Disney Plus users spend an average of 19.3 hours monthly streaming content.
On average, Disney Plus users use 2.25GB to 3GB of data per hour when streaming content on the automatic settings.
Meanwhile, Disney Plus users who stream on the data saver option utilize 1 GB to 1.5 GB per hour.
Source: Business2Community, Disney Plus Help.
How Many Titles Are Available On Disney+?
Disney Plus has 2,492 titles and is growing in its US content library.
These titles include 80 Disney Plus Originals, 1341 movies, 1,151 TV shows, and 15,000 episodes.
The titles available on Disney Plus include original series like Loki, The Proud Family: Louder and Prouder and The Mandalorian, etc.
Source: Disney, Ampere Analysis.
More Topics Like This:
Conclusion: Disney+ Has 131.6 Million Subscribers Worldwide
Disney+ is a significant player in the streaming industry, with 131.6 million subscribers as of Q4 2025. The platform’s average revenue per user stands at $8.04, and 30% of its subscribers are enjoying the benefits of the ad-supported tier.
With a revenue of $2.82 billion in Q1 2025 and a 12% market share, Disney+ ranks as the fourth most popular SVOD platform globally.
With popular content from Disney, Marvel, Pixar, and Star Wars, along with expanding its reach internationally, Disney+ remains a major competitor with a strong and steady viewership increase for the upcoming months.
