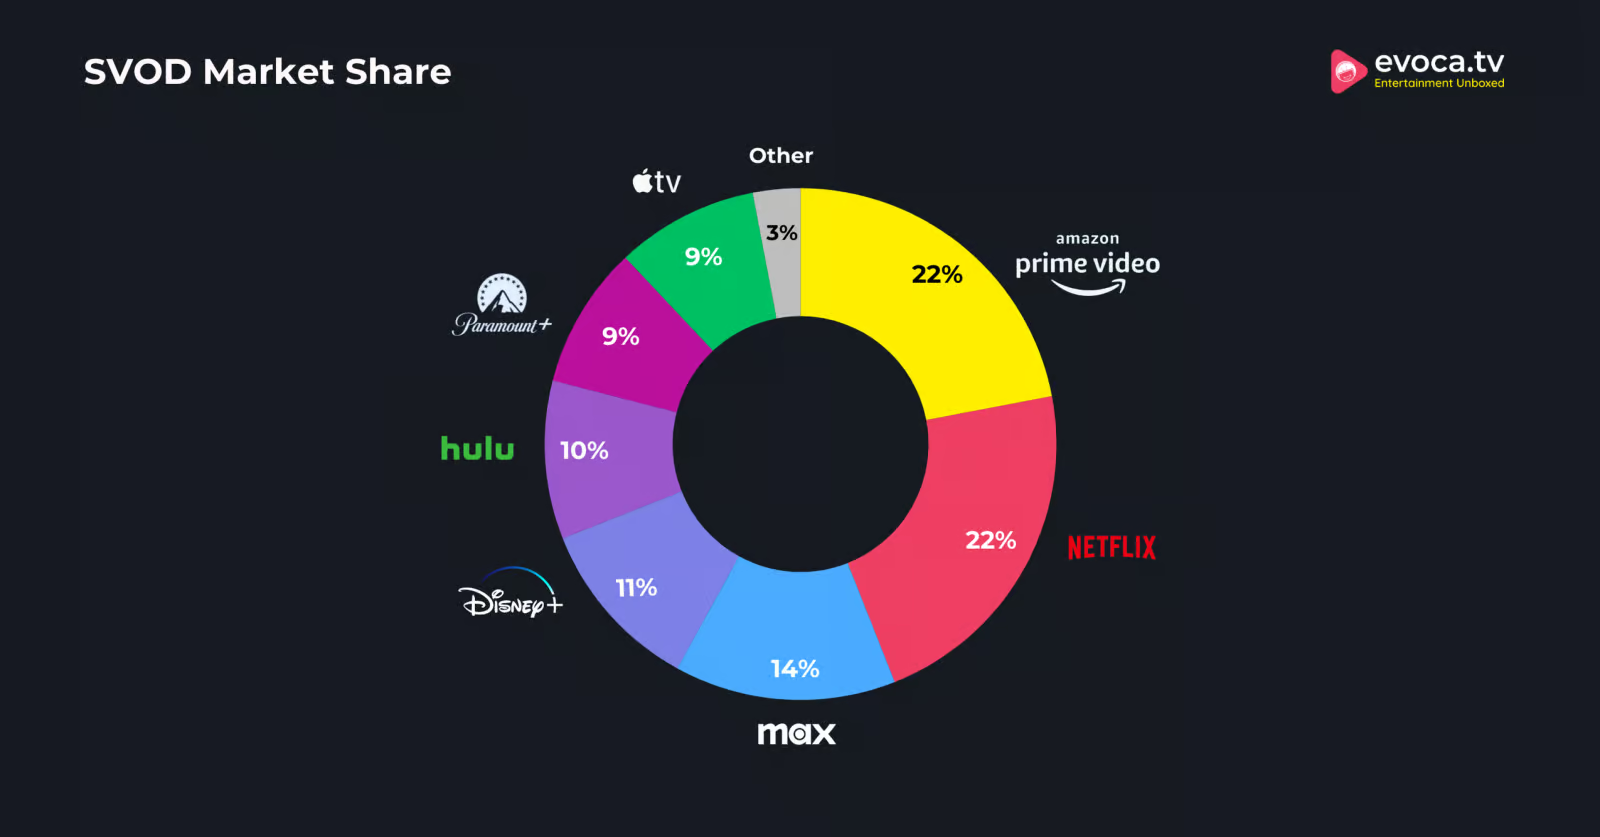
With 9% of the market share, Paramount Plus is one of the most popular SVOD platforms in the United States. Besides that, the majority of the traffic on its website comes from the United States, and more than half of Paramount Plus subscribers are males.
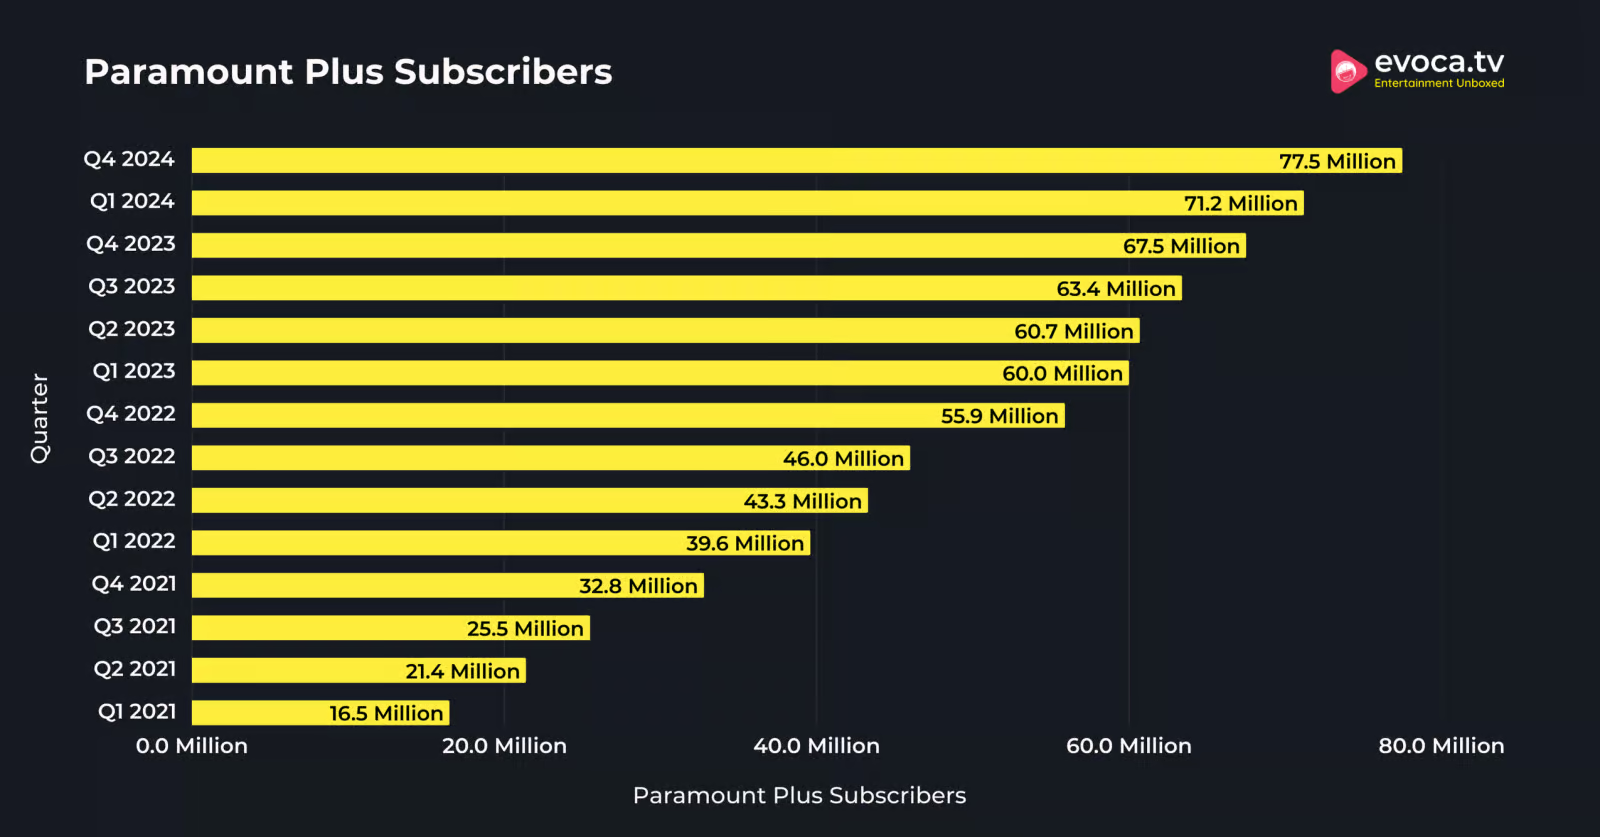
Throghout the years, Paramount Plus has managed to attract 77.5 million subscribers and is growing steadily.
Let’s explore the Paramount Plus subscriber count in detail, its user demographics, distribution of users by plans, market share, revenue, and other stats.
So what’s the wait for? Let’s get into it.
Paramount Plus Subscribers 2025: At Glance
- Paramount Plus has 77.5 million subscribers.
- 63% of the Paramount users use ad-free plans.
- 2.6 million households in the United Kingdom have subscribed to Paramount Plus.
- Paramount Plus has 9% of the SVOD market share.
- Paramount Plus revenue grew by 16% in Q4.
- 3,606 content titles were available on Paramount Plus.
- 49 million visits were recorded on Paramount Plus.
How Many Subscribers Does Paramount Plus Have?
Paramount Plus has reached 77.9 million subscribers as of Q4 of 2024.
That was an increase of 5.6 million subscribers compared to the past quarter. The number of Paramount Plus subscribers was recorded to be 67.5 million in Q4 2023.
Besides, the number of Paramount subscribers increased by 20.75% in the year 2023 as its subscriber count grew from 55.9 million in Q3 2024 to 67.5 million by the end of the year 2023.

Here is a table displaying the number of Paramount Plus subscribers recorded over the past quarters.
| Quarter | Paramount Plus Subscribers |
|---|---|
| Q2 2024 | 71.9 million |
| Q1 2024 | 71.2 million |
| Q4 2023 | 67.5 million |
| Q3 2023 | 63.4 million |
| Q2 2023 | 60.7 million |
| Q1 2023 | 60 million |
| Q4 2022 | 55.9 million |
| Q3 2022 | 46 million |
| Q2 2022 | 43.3 million |
| Q1 2022 | 39.6 million |
| Q4 2021 | 32.8 million |
| Q3 2021 | 25.5 million |
| Q2 2021 | 21.4 million |
| Q1 2021 | 16.5 million |
Paramount Plus Subscriber Demographics
51.73% of the Paramount Plus visitors are Male.
A large share of the paramount visitors are male. However, there isn’t a large difference between the share of male and female visitors on Paramount Plus.
48.27% of the visitors on Paramount Plus are female.
Source: Similar Web
Over 5 in 10 Paramount Plus visitors are aged 25 to 44 years.
This age group makes up a large share of Paramount Plus visitors.
Conversely, the fewest Paramount Plus visitors are aged 65 years or over, making up just 6.3% of the platform visitors.
Besides, the visitors aged 18 to 24 years make up 14.29% of the total visitors on Paramount Plus.
Here is a table displaying the distribution of Paramount Plus visitors by age group.
| Age Group | Percentage of Paramount Plus Visitors |
|---|---|
| 18 to 24 years | 14.29% |
| 25 to 34 years | 30.88% |
| 35 to 44 years | 21.92% |
| 45 to 54 years | 16.23% |
| 55 to 64 years | 10.37% |
| 65 and over | 6.3% |
Source: Similar Web
Paramount Plus Subscribers By Plan
63% of the Paramount users use ad-free plans.
On the other hand, just 37% of the Paramount Plus users preferred ad-supported plans.
Paramount Plus has the fourth-highest percentage of ad-free subscribers after Netflix, Disney Plus, and Max.
Here is a table displaying the percentage of ad-supported and ad-free users of different SVOD platforms.
| Video Streaming Services | Ad-supported | Ad-free |
|---|---|---|
| Paramount+ | 37% | 63% |
| Peacock | 77% | 23% |
| Hulu | 55% | 45% |
| Discovery+ | 45% | 55% |
| Max | 19% | 81% |
| Disney+ | 19% | 81% |
| Netflix | 7% | 93% |
Source: Statista
Paramount Plus Market Share
Paramount Plus had 9% of the SVOD market share and was the sixth most preferred SVOD platform in the United States.
Comparatively, Amazon Prime Video was the most preferred SVOD platform in the United States, with 22% of the SVOD market share.
Netflix, Max, and Disnety Plus are the other most preferred SVOD platforms in the United States.

Here is a table displaying the SVOD market share owned by different video streaming platforms in the United States.
| SVOD Platform | Market Share Of The Platform |
|---|---|
| Amazon Prime Video | 22% |
| Netflix | 22% |
| Max | 14% |
| Disney+ | 11% |
| Hulu | 10% |
| Paramount+ | 9% |
| Apple TV+ | 9% |
| Other | 3% |
Source: Statista.
Paramount Plus Revenue
Paramount Plus revenue grew by 33% YoY.
At the same time, the average revenue per user of Paramount Plus increased by 26% YoY.
Besides, the total revenue of Paramount+ grew by 16% for Q4 of 2024, but struggles to keep operating costs low.
Here is a table displaying the paramount revenue recorded over the years.
| Operating Segment | Q4 2024 | 2023 | 2022 |
|---|---|---|---|
| TV Media | 7.98 billion | 20.09 billion | 21.73 billion |
| Direct-to-Consumer | 2.01 billion | 6.74 billion | 4.90 billion |
| Filmed Entertainment | 1.08 billion | 2.96 billion | 3.71 billion |
Source: Statista, Paramount.
Paramount Content Statistics
3,606 content titles are available on Paramount Plus.
In terms of popularity, Sonic the Hedgehog 3, is approaching nearly $500 million at the global BO, to be the highest-grossing film in the franchise. This film is expected to be one of the 10 most profitable Paramount Pictures release in the last 10 years!
Compared to other SVOD platforms, Paramount Plus has the 8th-highest number of titles available on the platform.
Amazon Prime Video has the highest number of titles on the platform of 10,872. Other platforms with a high number of titles are Disney+, Hulu, Netflix, Hulu, etc.
Here is a table displaying the SVOD platforms and the number of titles available.
| Subscription Video-on-demand | Number Of Titles |
|---|---|
| Amazon Prime Video | 10,872 |
| Disney+, Hulu | 9,578 |
| Netflix | 8,391 |
| Hulu | 7,250 |
| Max | 6,928 |
| Peacock | 6,411 |
| Discovery+ | 6,132 |
| Paramount+ Premium | 3,606 |
| Disney+ | 2,525 |
Source: Statista
Paramount Plus spends the most on science fiction and fantasy content, with 28% of its spending on genres.
At the same time, 16% of Paramount’s content is spent on crime and thriller genres.
On the other hand, paramount Plus spends the least on the action and adventure genre.
Here is a table displaying the distribution of Paramount Plus’s content spending by genre.
| Genre | Distribution of Content Spending |
|---|---|
| Crime and thriller | 16% |
| Sci-Fi and fantasy | 28% |
| Comedy | 10% |
| Drama | 7% |
| Children and family | 17% |
| Romance | 9% |
| Documentary | 9% |
| Action and adventure | 2% |
| Other | 2% |
Source: Statista
Paramount with Showtime has 7 high-quality shows and 20 quality TV shows.
At the same time, there are 40 other TV shows available on the platform.
In comparison, Amazon Prime Video has 26 high-quality, which is the highest high-quality show compared to other platforms.
Here is a table displaying the number of quality shows available on different SVOD platforms.
| Characteristic | High-quailty TV Shows | Quality TV Shows | Other TV Shows Available |
|---|---|---|---|
| Discovery+ | 13 | 29 | 239 |
| Prime Video | 26 | 63 | 128 |
| Netflix | 23 | 71 | 63 |
| Hulu | 18 | 42 | 48 |
| Peacock Premium | 7 | 22 | 56 |
| Max | 12 | 20 | 48 |
| Paramount+ with Showtime | 7 | 20 | 40 |
| Disney+ | 6 | 14 | 30 |
| Apple TV+ | 3 | 7 | 9 |
Source: Statista
Paramount Plus Traffic Statistics
49 million visits were recorded on Paramount Plus.
Comparatively, in May 2024, 53.1 million visits were recorded on paramountplus.com in May 2024. That was a decrease of 7.72% in the traffic recorded on the Paramount website in June 2024 compared to that of May 2024.
Besides, 53 million visits were recorded on Paramount’s website in April 2024.
Here is a table displaying the traffic recorded on Paramount’s website over the past months.
| Month | Total Traffic Recorded |
|---|---|
| June 2024 | 49 million |
| May 2024 | 53.1 million |
| April 2024 | 53.5 million |
Source: Similar Web.
72.28% of the traffic on the Paramount website is from the United States.
The United States directs the highest traffic on Paramount Plus. Meanwhile, the second-highest share of the traffic on the Paramount website is from Australia. However, Australia directs just 4.19% of the traffic on the platform.
Here is a table displaying the share of traffic on the Paramount website directed from different countries worldwide.
| Country | Share Of Traffic |
|---|---|
| United States | 72.28% |
| Australia | 4.19% |
| Canada | 3.58% |
| Argentina | 3.05% |
| Brazil | 2.91% |
| Others | 13.99% |
Source: Similar web
Miscellaneous Paramount Statistics
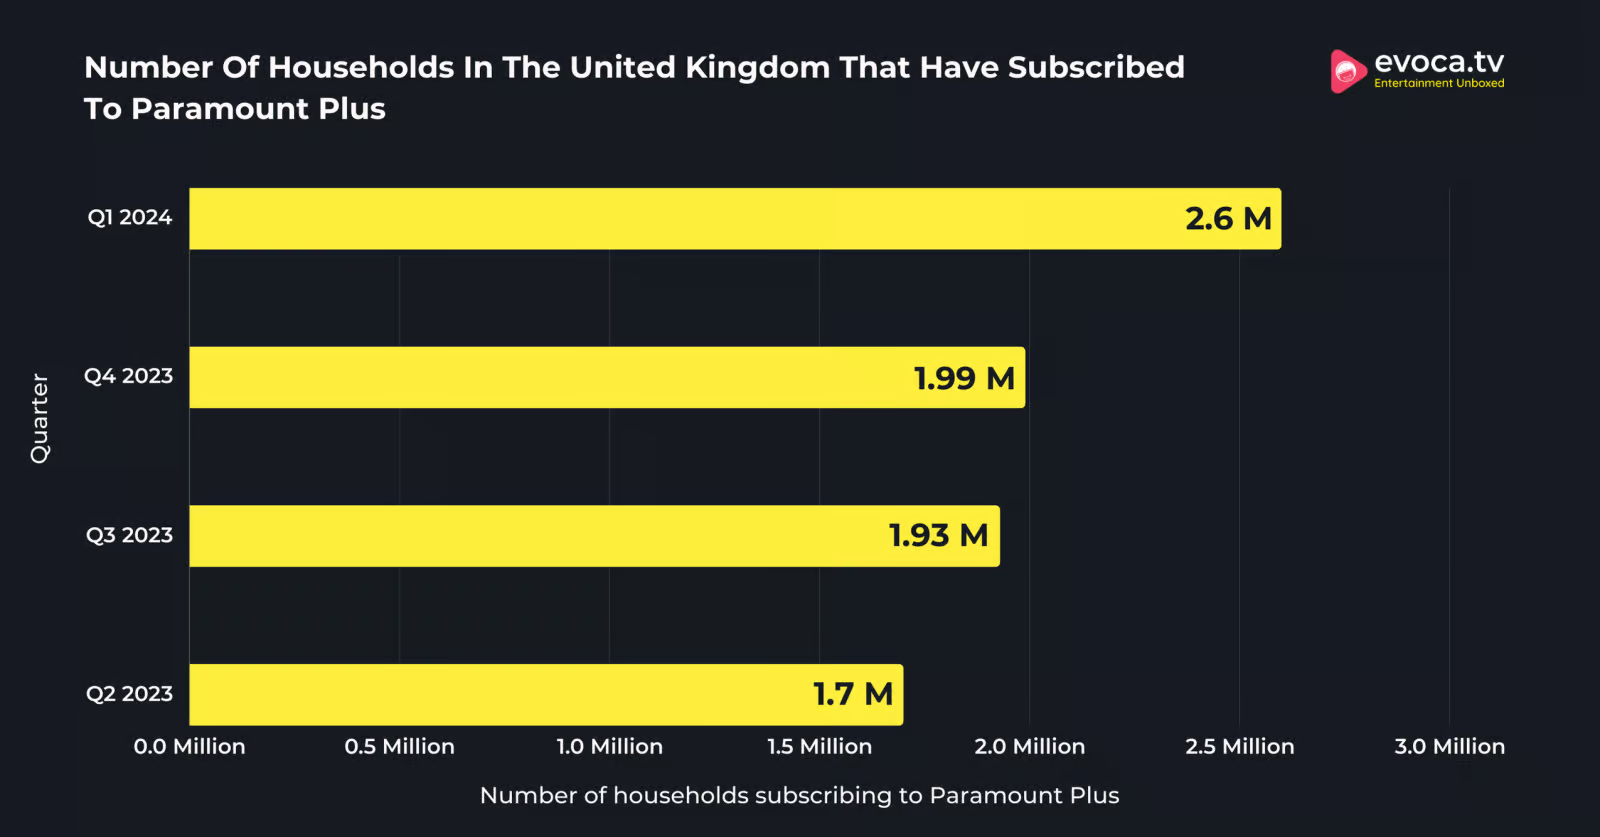
2.6 million households in the United Kingdom have subscribed to Paramount Plus.
That’s an increase of 0.61 million households that have subscribed to Paramount Plus compared to the past year. In Q4 2023, just 1.99 million households have subscribed to Paramount Plus.

Here is a table displaying the number of households in the United Kingdom that have subscribed to Paramount Plus.
| Quarter | Number of Households Subscribing to Paramount Plus |
|---|---|
| Q1 2024 | 2.6 million |
| Q4 2023 | 1.99 million |
| Q3 2023 | 1.93 million |
| Q2 2023 | 1.7 million |
Source: Statista
98% of the consumers in the United States were aware of Paramount Plus.
At the same time, just 65% of the consumers had an understanding of the platform.
On the other hand, 100% of the consumers in the country were aware of Netflix. However, just 88% of the consumers had an understanding of the platform.
Here is a table displaying the understanding and awareness of different SVOD platforms in the United States.
| Video Streaming Services | Awareness | Understanding |
|---|---|---|
| Netflix | 100% | 88% |
| Amazon Prime Video | 99% | 77% |
| Hulu | 99% | 72% |
| Disney+ | 98% | 76% |
| Paramount+ | 98% | 65% |
| Max | 98% | 64% |
| Peacock | 97% | 65% |
| Apple TV+ | 96% | 51% |
Source: Statista
On average, the cancellation rate of Paramount Plus subscriptions was recorded to be 16.9%.
The platform had the fourth-highest subscription cancellation rate in the United States compared to other platforms.
Max has the highest cancellation rate in the United States. 26.9% of consumers are likely to cancel their subscriptions from the platform.
Other platforms that had a high cancellation rate were Broadcast Services, Disney+, and Hulu.
Here is a table displaying the cancellation rate of different streaming platforms in the United States.
| Platform | Cancellation Rate |
|---|---|
| Max | 26.9% |
| Broadcast | 26.6% |
| Disney+ | 21.1% |
| Paramount+ | 16.9% |
| Hulu | 15.2% |
| Netflix | 10.2% |
| Peacock | 10% |
| Prime Video | 9% |
| Cable | 7.2% |
| Apple TV+ | 4.9% |
| Streaming overall | 12.2% |
| Linear TV overall | 10.8% |
Source: Statista
Nearly 6 in 10 consumers in the United States were satisfied with the quality of movies streaming on Paramount Plus in 2023.
That was an increase from just 5 in 10 consumers being satisfied by the quality of movies on Paramount Plus.
On the other hand, 55% of the people in the United States stated that they were satisfied with the variety of movies available on Paramount Plus.
Here is a table displaying the percentage of consumers in the United States who were satisfied with the variety of movies and the quality of movies available on Paramount Plus.
| Characteristic | 2022 | 2023 |
|---|---|---|
| Variety of movies | 49% | 55% |
| Quality of movies | 50% | 59% |
Source: Statista
Paramount Plus is anticipated to generate $8.40 in ad revenue per ad-supported viewer in 2024.
Further, the platform is projected to generate $9.36 in 2025 and $10.10 in ad revenue per ad-supported viewer in 2025 and 2026.
Paramount is predicted to have the lowest ad revenue per ad-supported viewer compared to other SVOD platforms.
Here is a table displaying the ad revenue per ad-supported viewer of Paramount Plus predicted for the upcoming year.
| Year | Ad Revenue Per Ad-supported Viewer |
|---|---|
| 2024 | $8.40 |
| 2025 | $9.36 |
| 2026 | $10.10 |
Source: Emarketer.
More On Paramount Plus:
Conclusion: 77.5 Million People Worldwide Have Subscribed To Paramount Plus!
The number of Paramount Plus subscribers increased by 5.6 million compared in the Q4 of 2024. With the increase in the number of subscribers, Paramount Plus’s revenue also increased by 16% in the quarter.
Considering the number of subscribers Paramount has gained in the past years, it is evident that the subscriber count will increase steadily in 2025 as well.
Above all, it is one of the most preferred SVOD platforms by the residents of the United States, and gas has attracted the attention of male and female residents equally.
