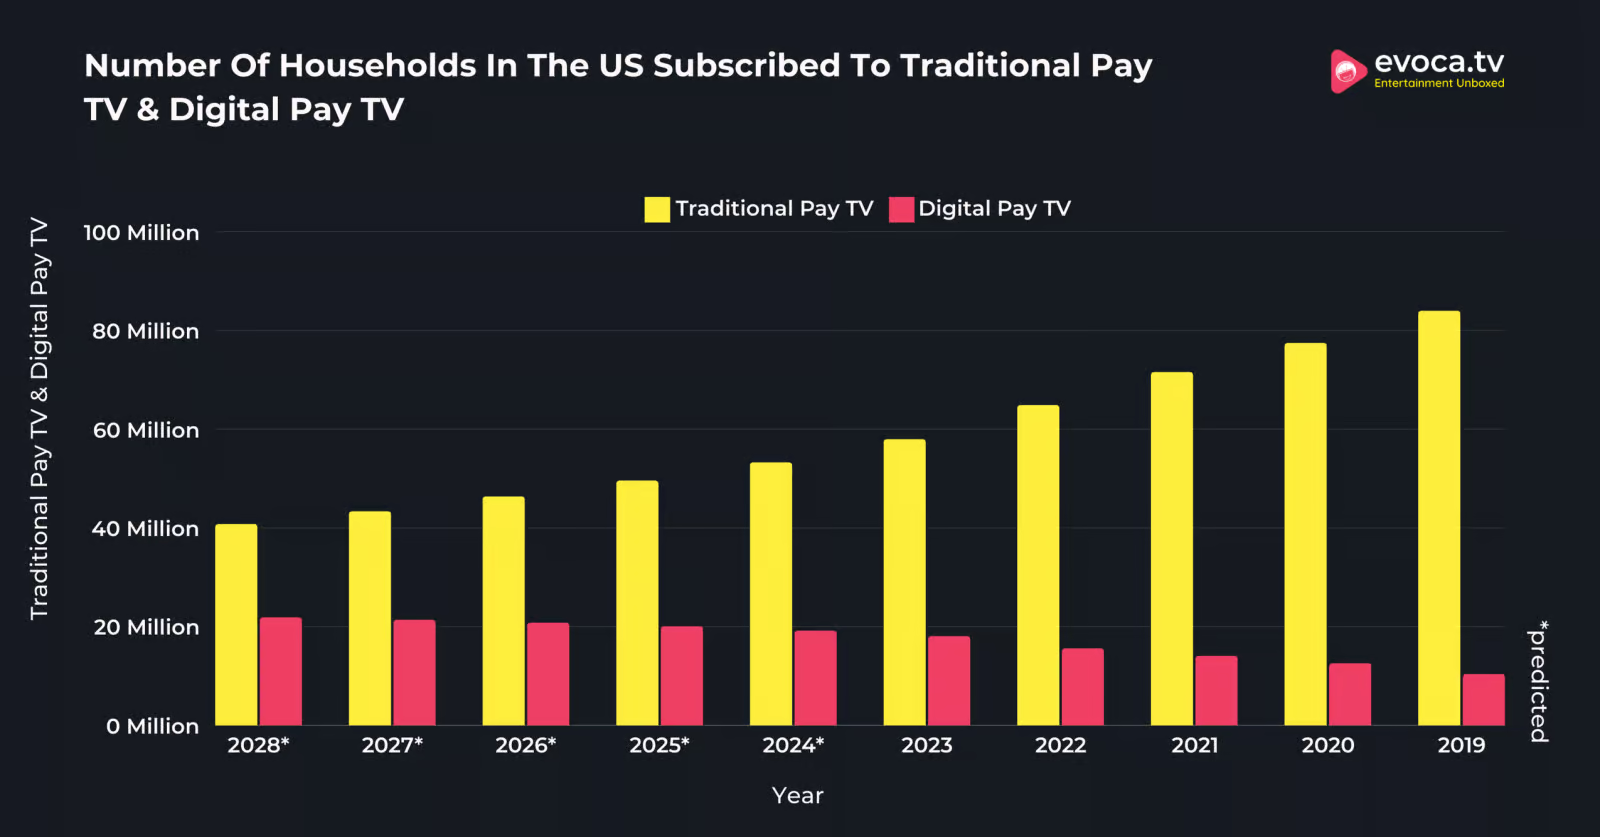
This might sound surprising, but the number of Pay TV households in the United States is projected to drop to 49.6 million in 2025 from 53.3 million in 2024.
Besides, the number of households with Pay-TV services in the United States declined by 31.22% between 2020 and 2024.
One primary reason for the decrease in the number of households with pay-TV subscriptions is the rapid adoption of streaming services and cord-cutting in the country.
In this article, we will examine the facts and figures about the number of pay TV households in the United States, the current state of pay TV, pay TV user demographics, and more.
How Many Pay TV Households Are There In The United States?
53.3 million households and 19.2 million are estimated to have subscribed to traditional and digital Pay TV, respectively.
Comparatively, 58 million households in the United States have traditional Pay TV subscriptions, and 18.1 million households have Digital Pay TV subscriptions in 2023.
The number of households subscribed to traditional Pay TV is estimated to reach 40.8 million by 2028, and the number of households with digital pay TV is estimated to reach 21.9 million by then.
Meanwhile, 64.9 million households subscribed to traditional Pay TV in 2022, and 15.6 million had digital Pay TV subscriptions.
These numbers prove that the number of households subscribed to traditional Pay TV is decreasing gradually, while the number of households subscribed to digital Pay TV is increasing.

Here is a table displaying the number of households in the United States that have subscribed to traditional Pay TV and Digital Pay TV.
| Year | Traditional Pay TV | Digital Pay TV |
|---|---|---|
| 2028* | 40.8 million | 21.9 million |
| 2027* | 43.4 million | 21.4 million |
| 2026* | 46.4 million | 20.8 million |
| 2025* | 49.6 million | 20.1 million |
| 2024* | 53.3 million | 19.2 million |
| 2023 | 58 million | 18.1 million |
| 2022 | 64.9 million | 15.6 million |
| 2021 | 71.6 million | 14.1 million |
| 2020 | 77.5 million | 12.6 million |
| 2019 | 84 million | 10.4 million |
*- Projected Numbers
Source: Statista.
Current State Of Pay TV Households In The US
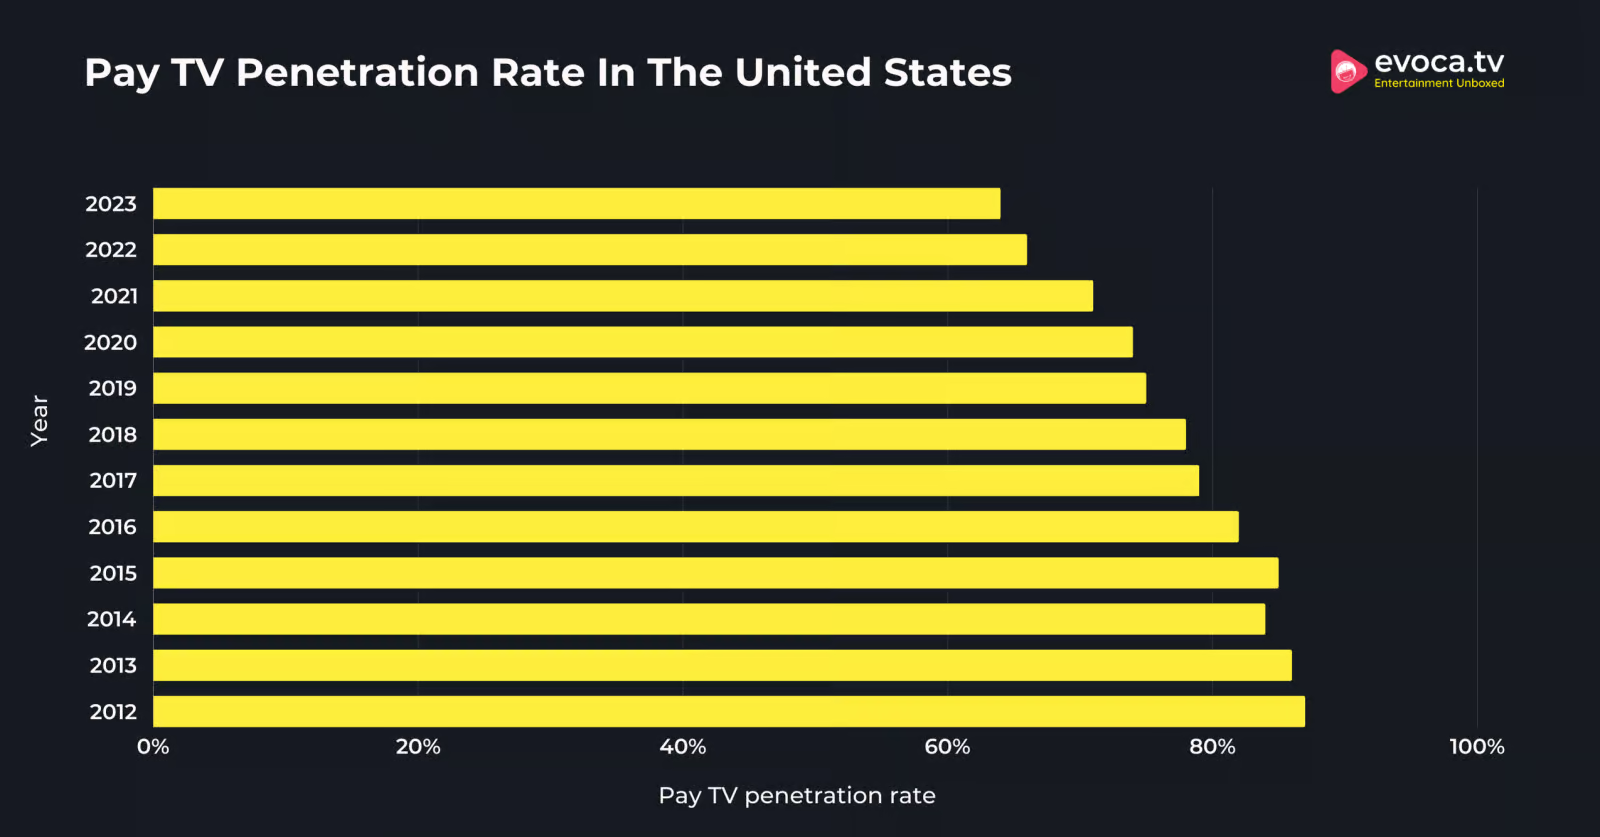
64% of the adults in the United States have a Pay TV service.
As of September 2023, nearly two-thirds of households in the United States had subscribed to a live pay TV service via cable, DBS, telco, or internet-delivered vMVPD.
However, the penetration rate of the pay-TV services has declined by two percentage points compared to the previous year. In 2022, the penetration rate of Pay TV was 66% in the United States.
Besides, the pay-TV penetration rate declined by 20 percentage points between 2014 and 2023 and will continue decreasing as consumers increasingly opt for video streaming service subscriptions.

Here is a table displaying the pay TV penetration rate in the United States.
| Year | Pay TV Penetration Rate (%) |
|---|---|
| 2023 | 64% |
| 2022 | 66% |
| 2021 | 71% |
| 2020 | 74% |
| 2019 | 75% |
| 2018 | 78% |
| 2017 | 79% |
| 2016 | 82% |
| 2015 | 85% |
| 2014 | 84% |
| 2013 | 86% |
| 2012 | 87% |
Source: Statista.
Pay TV is anticipated to generate a revenue of $81.33 billion by 2027.
Meanwhile, in 2024, the Pay TV is projected to gather a revenue of $84.29 billion.
Comparatively, the Pay TV revenue was recorded to be $84.89 billion in 2023.
The Pay TV revenue recorded over the past years represents a decline amid cord-cutting and a majority of consumers shifting from pay TV services to streaming services.
Here is a table displaying the revenue of Pay TV services over the years:
| Year | Pay TV Revenue |
|---|---|
| 2027* | 81.33 billion |
| 2026* | 82.39 billion |
| 2025* | 83.42 billion |
| 2024* | 84.29 billion |
| 2023 | 84.89 billion |
| 2022 | 86.21 billion |
| 2021 | 93.17 billion |
| 2020 | 93.83 billion |
| 2019 | 97.53 billion |
| 2018 | 98.81 billion |
| 2017 | 100.09 billion |
*- Projected Values
Source: Statista.
Demographics Of Pay TV Subscribers
Just 56% of the households with adults aged 18 to 44 years in the United States subscribed to a Pay TV service.
That was a decrease of one-fifth in the number of households subscribed to Pay TV services compared to 70% of the adults recorded 5 years ago.
Meanwhile, a decade ago, 83% of the households with adults aged 18 to 44 years subscribed to a pay-TV service.
At the same time, the share of households subscribed to a pay-TV service with adults aged over 45 has also declined.
Only 70% of such households have subscribed to a pay-TV service. Comparatively, 5 years ago, 83% of such households subscribed to pay-TV services, and a decade ago, 88% of such households subscribed to pay-TV services.
Source: Marketing charts.
Factors Influencing PayTV Subscription Trends
46% of the adults in the United States stated that they prefer Pay TV subscriptions as they can get access to lots of channels.
Meanwhile, a third of the consumers said they prefer pay-TV services for high image and sound quality.
Another one-third of the consumers stated that they prefer Pay TV as they wish to get access to sports content.
Here is a table displaying the drivers of pay TV subscriptions in the United States.
| Drivers of TV Subscription Payments In The United States | Percentage Of People |
|---|---|
| To access lots of channels | 46% |
| To access specific films or TV shows | 38% |
| Good value for money | 35% |
| High image and sound quality | 33% |
| To access sports | 33% |
| To access original/ exclusive content | 31% |
| Came with the internet package | 30% |
| To access pay-per-view channels | 20% |
| To avoid illegal downloading/streaming | 18% |
| Is part of the rental agreement | 16% |
| Other | 4% |
| Don’t know | 3% |
Source: Statista.
Miscellaneous Pay TV Subscriber Statistics
10% of adults in the United States said that they are extremely likely to cancel their pay-TV subscription in the next 12 months.
16% of adults in the United States stated wanting to cancel their pay-TV subscription.
At the same time, the second majority of adults who wished to cancel their pay TV subscription belonged to the 18 to 34-year-old group.
Conversely, just 4% of the country’s adults over 55 stated that they wished to cancel their subscriptions.
Here is a table displaying the projected percentage of adults in the United States who are likely to cancel their pay-TV subscription in the next 12 months, as of March 2024.
| Age Group | 1 (Not At All Likely) | 2 | 3 | 4 | 5 (Extremely Likely) |
|---|---|---|---|---|---|
| All | 41% | 20% | 17% | 11% | 10% |
| 18-34 years | 35% | 14% | 21% | 15% | 15% |
| 35-54 years | 33% | 20% | 18% | 13% | 16% |
| 55 years and older | 50% | 22% | 15% | 9% | 4% |
Source: Statista.
Over 4 in 10 adults in the United States said they would subscribe to subscription-based VOD services after canceling their pay-TV subscription.
Meanwhile, around 40% of the adults in the country stated that they were likely to cancel their pay TV subscription in the next year and switch to another Pay-TV provider.
Source: Statista.
Pay TV providers in the United States lost 5.04 million subscribers in 2023.
That was up from 4.6 million subscribers lost in the previous year.
Traditional pay-TV companies lose more subscribers every year, while video streaming companies gain subscribers and flourish.
Source: Statista.
Conclusion: The Number Of Pay TV Subscribers Is Estimated To Reduce To 49.6 million in 2025
The number of pay TV subscribers in the United States has declined rapidly in recent years, and will continue to do so!
Seeing the trend in the number of Pay TV subscriptions in the United States, it is evident that the number will likely decrease in the upcoming decade.
This is mainly due to increased cord-cutting and the shift of people in the United States towards streaming services. As this shift grows towards OTT platforms, we may see the PAY TV subscription rates to drop even lower, maybe even beyond our projections.
