As of 2025, Amazon Prime remains a top global subscription service with over 200 million members. In the U.S., membership has grown to 180.1 million, with 76.6 million households using Prime.
Amazon Prime Video holds 22% of the U.S. streaming market, competing strongly with Netflix. Amazon Music also attracts around 52.5 million U.S. users.
This article covers the latest Amazon Prime statistics, including its number of users, usage, demographics, revenue, and the latest facts and figures about Prime Video, Amazon Music, and Prime Day sales.
Amazon Prime Statistics 2025 — Key Highlights
- Amazon Prime has over 200 million subscribers worldwide.
- In the U.S., 180.1 million people use Amazon Prime.
- Amazon Prime Video holds 22% of the U.S. streaming market.
- About 52.5 million Americans use Amazon Music.
- Global Prime Day sales hit $12.9 billion in 2023.
- U.S. Prime Day sales reached $14.2 billion in 2024.
How Many Amazon Prime Members Are There?
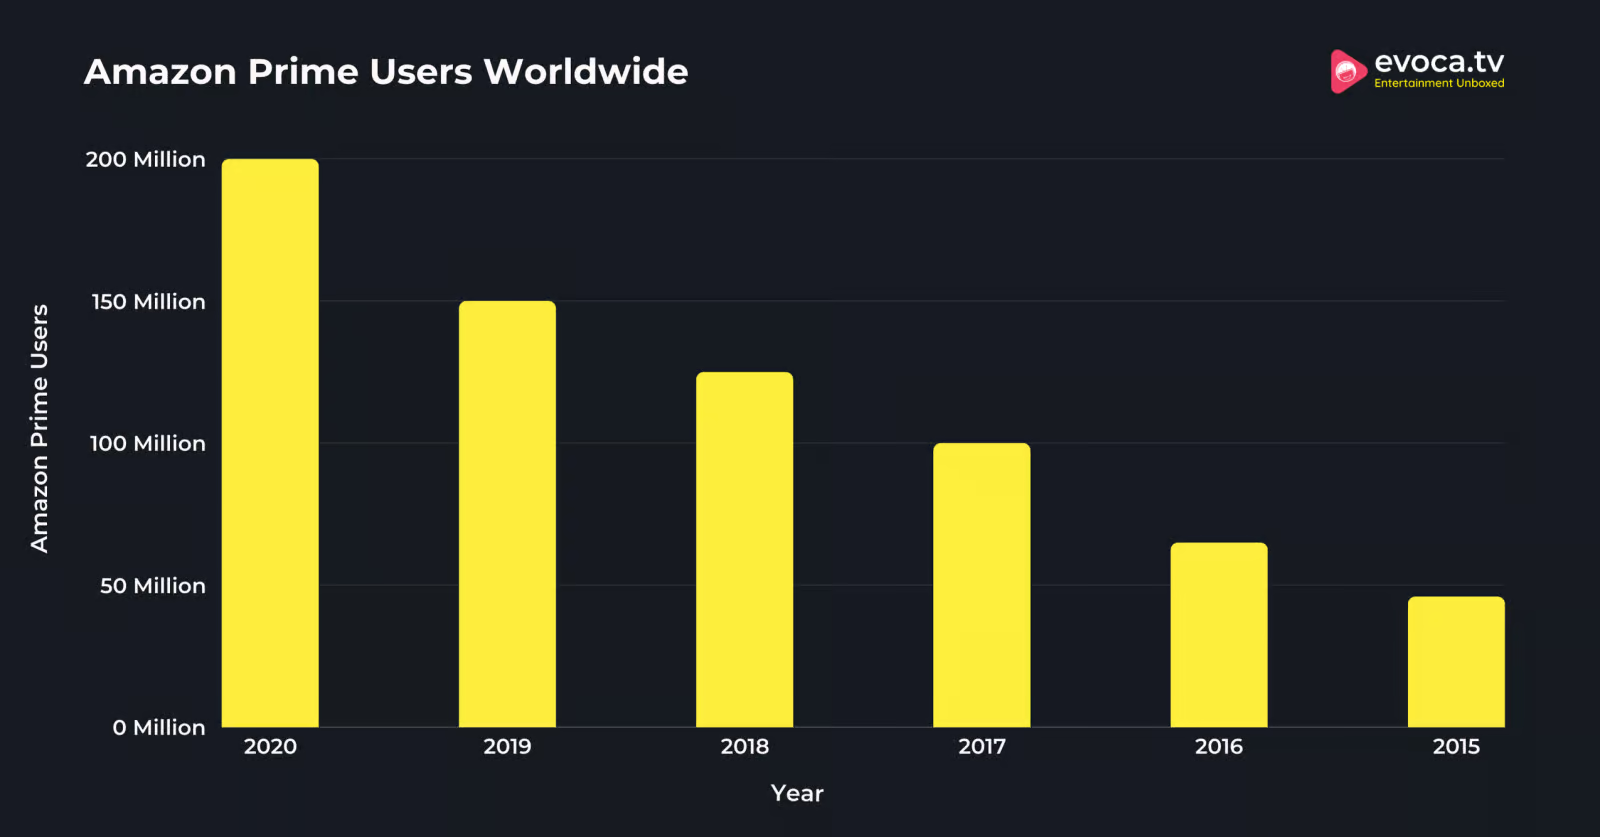
Amazon Prime has over 200 million subscribers worldwide.
That was a 33.33% increase in Amazon Prime users compared to the 150 million users recorded in 2019.
The details about the number of Amazon Prime users were last disclosed in 2020, and the data about the Prime users between 2020 and 2024 is not yet disclosed.

The following table displays the number of Amazon Prime users recorded over the years.
| Year | Amazon Prime Users Worldwide | Growth Rate |
|---|---|---|
| 2020 | 200 million | 33.33% |
| 2019 | 150 million | 20% |
| 2018 | 125 million | 25% |
| 2017 | 100 million | 53.85% |
| 2016 | 65 million | 41.30% |
| 2015 | 46 million | – |
Source: Statista.
How Many Amazon Prime Members Are In The United States?
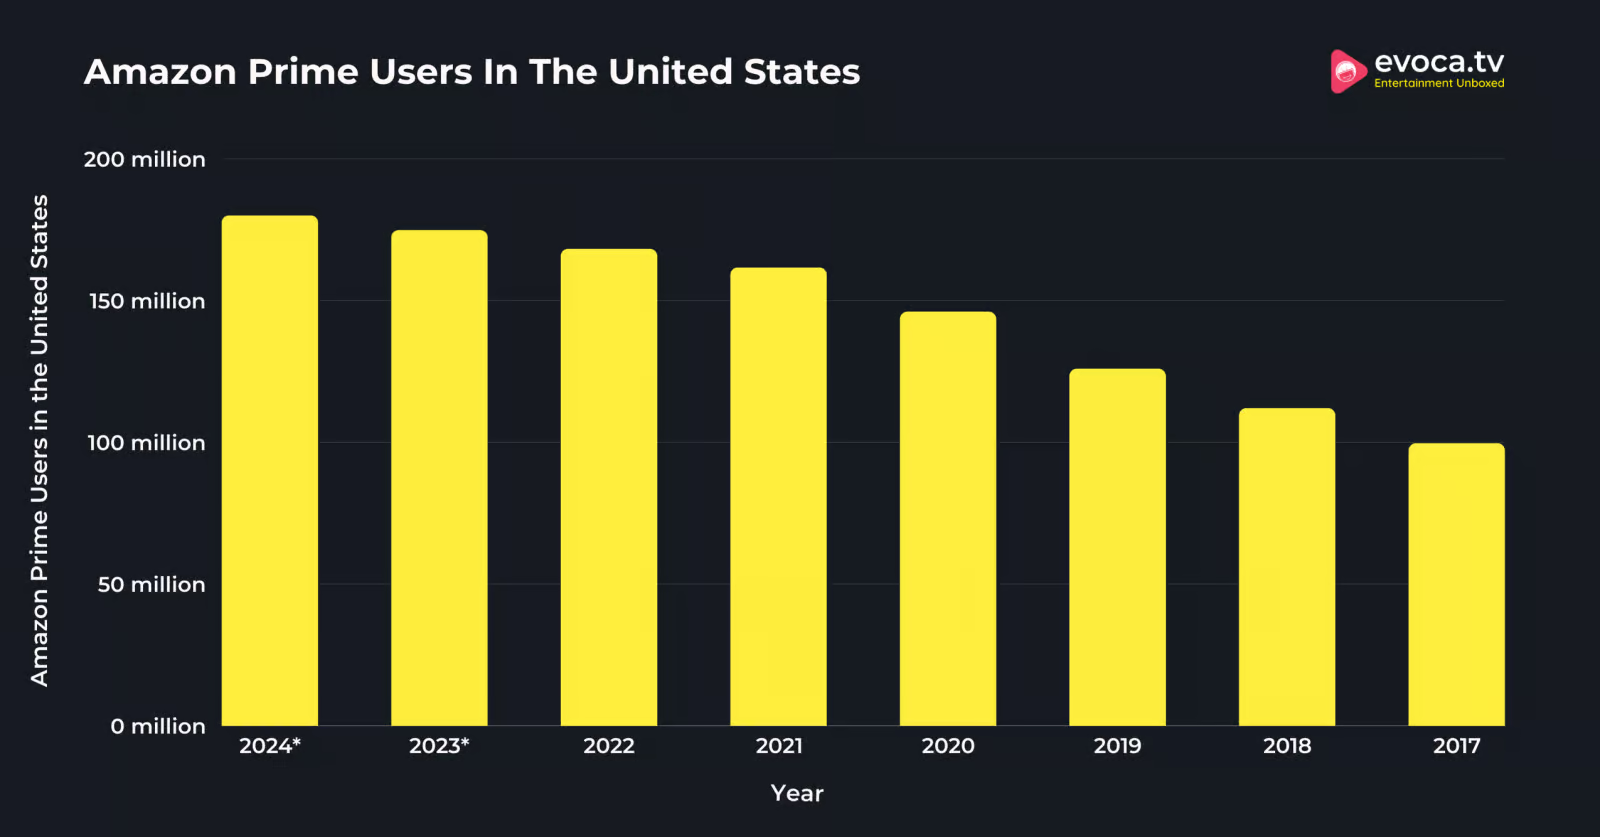
180.1 million Americans are estimated to use Amazon Prime.
That is a growth of 2.97% compared to 174.9 million estimated Prime users in 2023.
Besides, the Amazon Prime subscribers grew by 68.81% between 2017 and 2022.

The following table displays the number of Amazon Prime users recorded in the United States over the years.
| Year | Amazon Prime Users in the United States | Growth Rate |
|---|---|---|
| 2024* | 180.1 million | 2.97% |
| 2023* | 174.9 million | 3.92% |
| 2022 | 168.3 million | 4.08% |
| 2021 | 161.7 million | 10.68% |
| 2020 | 146.1 million | 15.95% |
| 2019 | 126 million | 12.4% |
| 2018 | 112.1 million | 12.44% |
| 2017 | 99.7 million | – |
*- Estimated Values
Source: Statista.
U.S. Household With Amazon Prime members
In 2022, 76.6 million households in the United States were estimated to have an Amazon Prime subscription.
That was an increase of 2.2 million households compared to 74.4 million in the United States with an Amazon Prime Subscription.
Further, the number of households with an Amazon Prime subscription in the United States was estimated to have increased by 27.45% or 16.5 million between 2018 and 2022.
The following table displays the number of households in the United States with Amazon Prime Subscription.
| Year | Number of Households In The United States With Amazon Prime Subscription |
|---|---|
| 2022* | 76.6 million |
| 2021* | 74.4 million |
| 2020* | 71.3 million |
| 2019 | 66.4 million |
| 2018 | 60.1 million |
Source: Statista.
Amazon Prime Members: U.S. Demographics
82.4% of the Bridge Millennials who used the internet were Amazon Prime users in the United States.
Compared to other generations that used the internet, most of the Bridge Millennials were Prime subscribers.
At the same time, 75.2% of GenZ internet users and 80.3% of Millennial internet users were subscribed to Amazon Prime in the United States.
The following table displays the usage penetration of Amazon Prime among internet users of different age groups.
| Generation | Share of Internet Users |
|---|---|
| Generation Z | 75.2% |
| Millennials | 80.3% |
| Bridge millennials | 82.4% |
| Generation X | 76.2% |
| Baby boomers and seniors | 56.6% |
Source: Statista.
Amazon Prime Video Statistics
Amazon Prime Video is the most popular SVOD platform in the United States, with 22% of the market share.
Netflix follows Amazon Prime Video with 21% of the SVOD market share in the country.
Other most popular SVOD platforms in the United States are Max, Disney+, and Hulu.
The following table displays the share of Amazon Prime Video in the SVOD Market.
| Platform | Market Share In US |
|---|---|
| Amazon Prime Video | 22% |
| Netflix | 21% |
| Max | 13% |
| Disney+ | 12% |
| Hulu | 10% |
| Paramount+ | 9% |
| Apple TV+ | 8% |
| Peacock | 1% |
| Other | 3% |
Source: Statista.
163.6 million Amazon Prime Video viewers are from the United States.
At the same time, 65.9 million Amazon Prime Video viewers are from India, and 26.9 million are from the United Kingdom.
The following table displays the number of Amazon Prime viewers in selected countries.
| Country | Amazon Prime Video Viewers |
|---|---|
| United States | 163.6 million |
| India | 65.9 million |
| Germany | 32.3 million |
| United Kingdom | 26.9 million |
| Japan | 16.2 million |
| Canada | 14.6 million |
| France | 13.6 million |
| Australia | 4.9 million |
Source: Emarketer.
Amazon spent $18.9 billion on TV shows, Movies, and music content on the platform.
That was an increase of over $2.3 billion in 2023 compared to the content spending of $16.6 recorded in 2022.
Besides, Amazon’s content spending grew from $1.2 billion in 2013 to $18.9 billion in 2023, an overall increase of $17.7 billion or 1,475% in content spending by Amazon.
The following table displays Amazon’s spending on video and music content on the platform.
| Year | Content Spending On Amazon |
|---|---|
| 2023 | $18.9 billion |
| 2022 | $16.6 billion |
| 2021 | $13 billion |
| 2020 | $11 billion |
| 2019 | $7.8 billion |
| 2018 | $6.7 billion |
| 2017 | $4.5 billion |
| 2015 | $2.7 billion |
| 2013 | $1.2 billion |
Source: Statista.
Amazon generated an estimated annual ARPU of $39.
However, it spent $50 per user on content in 2023.
Comparatively, Netflix spent $73 per user. Its annual average revenue per user was $214 in 2023.
Hence, Netflix is estimated to generate more revenue per user than Amazon Prime.
Source: Statista.
Here are some additional statistics on Amazon Prime Video:
- 7 in 10 Prime members stream video on Amazon Prime Video every month
- Amazon Prime Video is available in over 200 countries.
- According to a 2022 survey, 15% of the respondents watched the content daily on Amazon Prime Video, while 46% stated that they had not used Amazon Prime Video for streaming content.
- Amazon Prime Video membership costs $8.99 per month.
Source: Statista, Gitnux, Amazon.
Amazon Prime Music Statistics
An estimated 52.5 million people in the United States listen to music on Amazon Prime.
Comparatively, in 2022, 50.7 million people in the United States listened to Amazon Music. This shows that Amazon Music listeners grew by nearly 2 million between 2022 and 2023.
Amazon Prime members have access to over 100 million songs ad-free, the largest selection of ad-free podcasts, and thousands of playlists and stations.
The following table displays the number of Amazon Music listeners in the United States recorded over the years.
| Year | Number of Amazon Music Listeners In The United States |
|---|---|
| 2023 | 52.5 million |
| 2022 | 50.7 million |
| 2021 | 48.3 million |
| 2020 | 45.8 million |
| 2019 | 38.7 million |
| 2018 | 30.4 million |
| 2017 | 21.5 million |
Source: Statista, Amazon.
Here are some Additional Statistics on Amazon Prime Music:
- Amazon Prime Music has over 1 million downloads on the Google Play.
- Amazon Music has over 82.2 million users worldwide.
- Amazon Music is available in 41 countries and territories.
- Over 1 million podcast titles are available on Amazon Music.
- Amazon is the fourth largest music streaming platform worldwide, with a market share of 8.2%.
Source: Google Play Store, Zipdo, Gitnux.
Amazon Prime Revenue
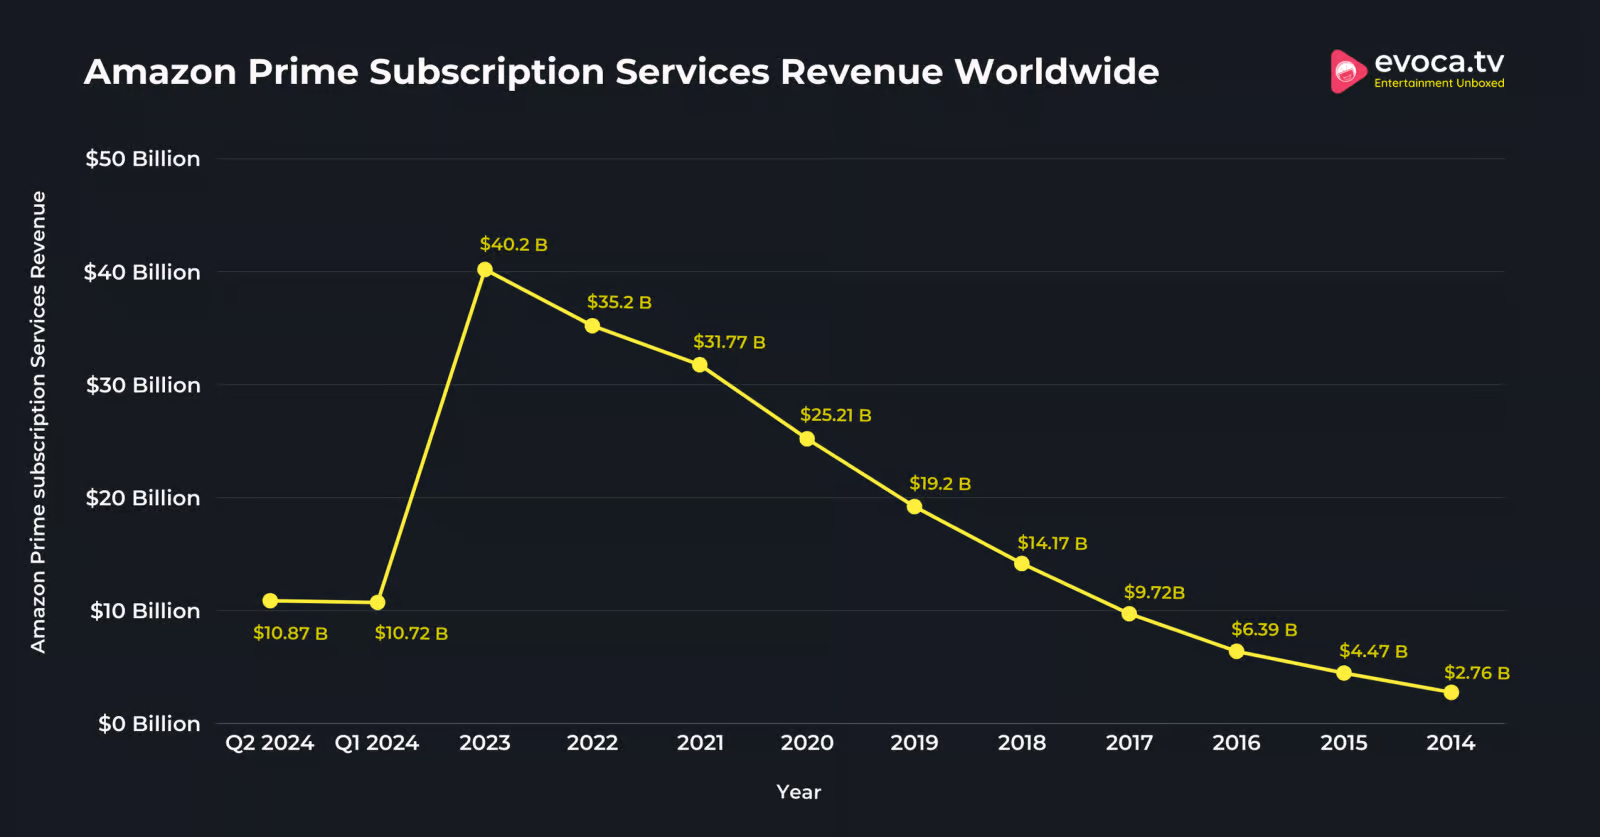
The subscription revenue of Amazon Prime was registered to be $10.87 billion in Q2 2024.
Meanwhile, in Q1 2023, Amazon Prime subscription revenue was $10.72 billion.
Amazon Prime Subscription services revenue increased from $2.76 billion in 2014 to $40.2 billion in 2023, an overall increase of 1,356.52%.

The following table displays the revenue generated by Amazon Prime Subscription services and the YoY growth in revenue.
| Year | Amazon Prime Subscription Services Revenue | YoY Growth Rate |
|---|---|---|
| Q2 2024 | $10.87 billion | – |
| Q1 2024 | $10.72 billion | – |
| 2023 | $40.2 billion | 14.14% |
| 2022 | $35.22 billion | 10.86% |
| 2021 | $31.77 billion | 26.02% |
| 2020 | $25.21 billion | 31.23% |
| 2019 | $19.21 billion | 35.57% |
| 2018 | $14.17 billion | 45.78% |
| 2017 | $9.72 billion | 52.11% |
| 2016 | $6.39 billion | 42.95% |
| 2015 | $4.47 billion | 61.96% |
| 2014 | $2.76 billion | – |
Source: Statista.
Amazon Prime Day Sales Worldwide
Global Amazon Prime Day sales amounted to $12.9 billion in 2023.
That was an increase of 900 million or 7.5% compared to the sales of $12 million recorded in 2022.
Amazon sales generated were recorded to be the highest to date in 2023 and have been steadily increasing since 2015.
Between 2015 and 2023, sales increased by 1333.33% or 12 billion.
The following table displays the Global Amazon Prime Day sales recorded between 2015 and 2023.
| Year | Amazon Prime Day Sales Worldwide |
|---|---|
| 2023 | $12.9 billion |
| 2022 | $12 billion |
| 2021 | $11.2 billion |
| 2020 | $10.4 billion |
| 2019 | $7.16 billion |
| 2018 | $4.19 billion |
| 2017 | $2.41 billion |
| 2016 | $1.52 billion |
| 2015 | $0.9 billion |
Source: Statista.
Amazon Prime members purchased 300 million items in 2024 during the Prime Day sale.
That was a decrease of 75 million items purchased compared to 375 million items purchased in 2023.
The number of Items purchased by consumers in 2023 was highest compared to the figures recorded over the years.
Further, between 2018 and 2023, the number of items purchased during Amazon Prime Day sales increased by 275 million.
The following table displays the number of items purchased by shoppers during the Amazon Prime Day sales between 2018 and 2023.
| Year | Number Of Items Purchased During Amazon Prime Day Sales |
|---|---|
| 2024 | 300 million |
| 2023 | 375 million |
| 2022 | 300 million |
| 2021 | 250 million |
| 2019 | 175 million |
| 2018 | 100 million |
Source: Statista.
Amazon Prime Day Sales In The United States
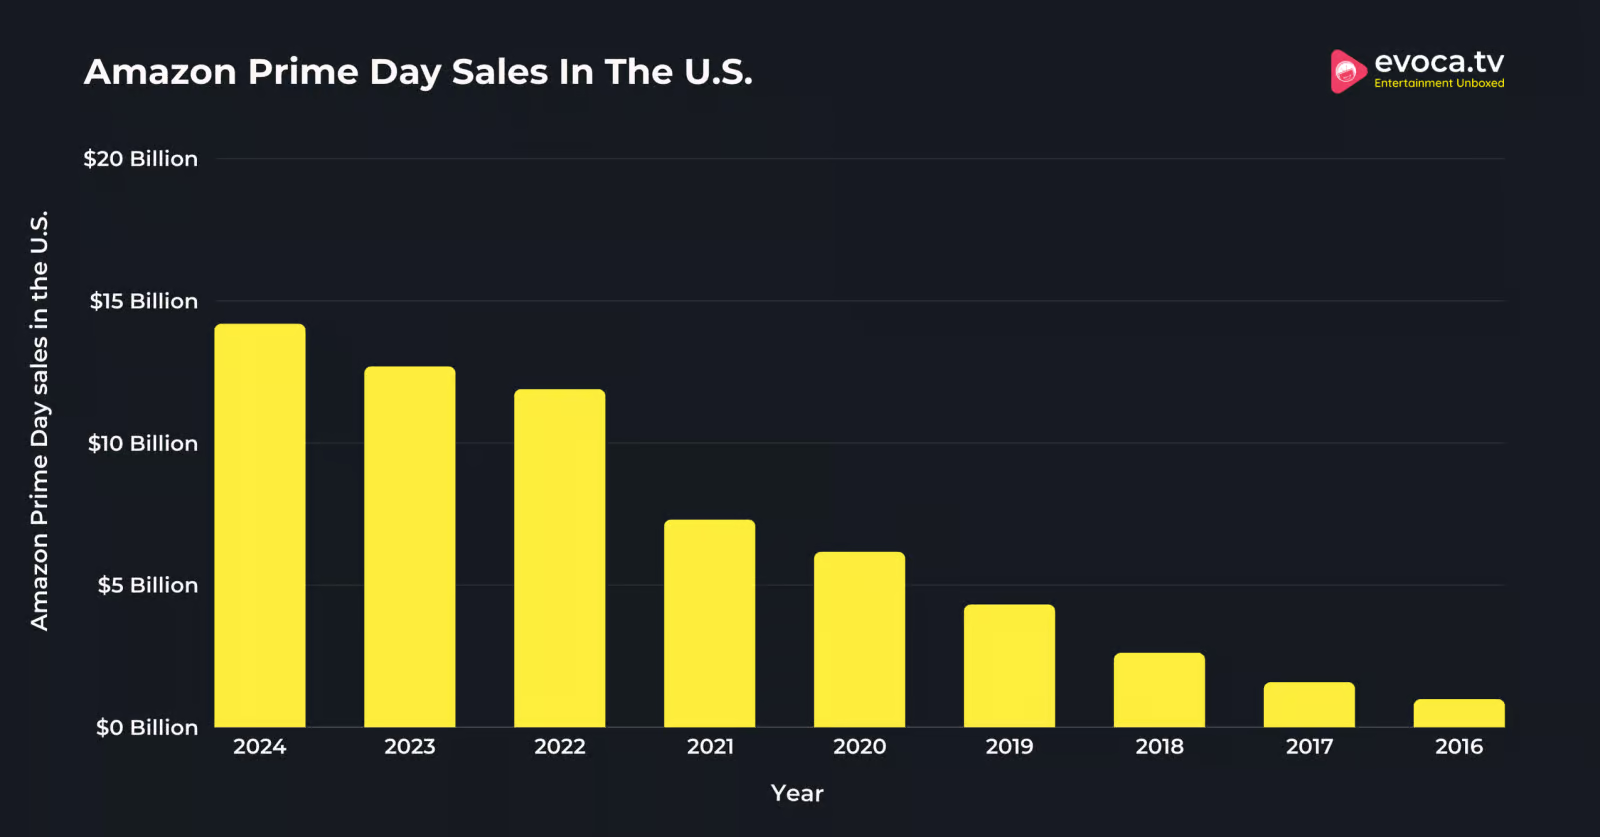
Amazon Prime Day sales in the United States in 2024 amounted to $14.2 billion during the two-day Prime Day sale.
That’s an increase of 11% compared to the sales of $12.7 billion recorded in 2023 during the Amazon Prime Day sale.
In 2022, Amazon Prime Day sales in the United States amounted to $11.9 billion. This data states that Amazon Sales in the U.S. increased by $1.8 billion in 2023 compared to 2022.
The Amazon Prime Day sales in the US increased from $0.99 billion in 2016 to $12.7 billion in 2023, displaying an overall sales growth of $11.7 billion or 1,182.83%.

The following table displays the Amazon Prime Day sales in the United States recorded over the past few years.
| Year | Amazon Prime Day Sales In The U.S. |
|---|---|
| 2024 | $14.2 billion |
| 2023 | $12.7 billion |
| 2022 | $11.9 billion |
| 2021 | $7.31 billion |
| 2020 | $6.17 billion |
| 2019 | $4.32 billion |
| 2018 | $2.62 billion |
| 2017 | $1.59 billion |
| 2016 | $0.99 billion |
Source: Statista.
Cost Of Amazon Prime Membership
The Amazon Prime Membership costs $14.99 per month or $139 per year.
At the same time, the students can get an Amazon Prime Student membership for just $7.49 per month or $69 per year.
On the other hand, the Prime Shipping-only plan will cost the users $14.99 per month. However, this is an invitation-only plan.
Source: Amazon Help.
Miscellaneous Amazon Prime Statistics
Amazon Prime account can have up to three devices logged in at once.
Users can stream content concurrently on these three devices. However, only two devices can stream the same content simultaneously.
Source: Amazon help.
Most Prime users in the United States make 2 to 4 orders per month.
According to a 2022 survey conducted in the United States, 42% of Prime users place 2 to 4 orders monthly.
Meanwhile, 36% or over one-third of Prime users in the United States order 5 to 10 orders from Amazon in a month.
Only 6% of the respondents said they placed 11 to 19 orders in a month, while 7% said they placed over 16 orders.
The following table displays the number of orders placed per month by Amazon Prime Users in the United States.
| Number Of Orders Per Month | Share of Prime Users In The U.S. |
|---|---|
| 0 to 1 orders | 9% |
| 2 to 4 orders | 42% |
| 5 to 10 orders | 36% |
| 11 to 19 orders | 6% |
| Over 16 orders | 7% |
Source: Statista.
56% of Amazon Prime members believed that Amazon Prime was best at speedy delivery.
Over half of Amazon Prime members were satisfied with the platform’s delivery speed, and another 53% said that it was easy to find products on the platform.
Additionally, 40% of the prime members stated they were satisfied with the personalized offers, while 48% were satisfied with the price.
The following table displays Amazon Prime users’ perception of its selected services worldwide.
| Amazon Is Best At | Share Of Prime Members |
|---|---|
| Speedy delivery | 56% |
| Easy to find products searched | 53% |
| Easy returns process | 48% |
| Price | 48% |
| Customer service | 46% |
| Personalized offers | 40% |
| Environmentally friendly options | 35% |
Source: Statista.
99% of Amazon Prime members in the United States renewed their subscriptions for a second year.
At the same time, 72% of the people purchased a subscription after having a 30-day trial, while 97% of the Prime members renewed their subscription for the second year.
The following tableau displays the Amazon Prime retention rates in the United States recorded over the years.
| Year | Subscribed After 30-day Trial | One Year Renewal | Two Year Renewal |
|---|---|---|---|
| Q1 2023 | 72% | 97% | 99% |
| Q1 2022 | 67% | 96% | 99% |
| Q1 2021 | 69% | 93% | 98% |
| Q1 2020 | 70% | 89% | 95% |
| Q1 2019 | 64% | 93% | 97% |
| Q1 2018 | 71% | 92% | 97% |
| Q1 2017 | 72% | 91% | 95% |
| Q1 2016 | 73% | 91% | 96% |
Source: Statista.
80% of the members said they purchased from Amazon for fast and free shipping.
Meanwhile, 69% of Prime members have a Membership due to the wide selection of products available.
The desire to use Prime membership made 66% of the members purchase it, while 49% of the users have membership due to the best product prices.
Moreover, 44% of the people stated that they purchased Prime membership to get access to easy returns.
Source: Amzscout.
Conclusion: Amazon Has Over 200 Million Prime Subscribers Worldwide
The number of Amazon Prime subscribers worldwide was recorded to be 200 million in 2023, but no official update has been released since then.
On the financial side, Amazon confirmed earning $21.59 billion from subscriptions in just the first half of 2024. Subscription revenue has been growing steadily since 2014, with a massive $37.44 billion increase between 2014 and 2023.
Besides, Amazon Prime Video holds 22% of the U.S. streaming market, making it a top competitor in the SVOD industry.
That was all about Amazon Prime Statistics. Here are some related reads you can check out:
