Holding an 11% market share, Hulu is one of the most popular streaming services in the United States, and its vast library of content includes hit TV shows, movies, and originals.
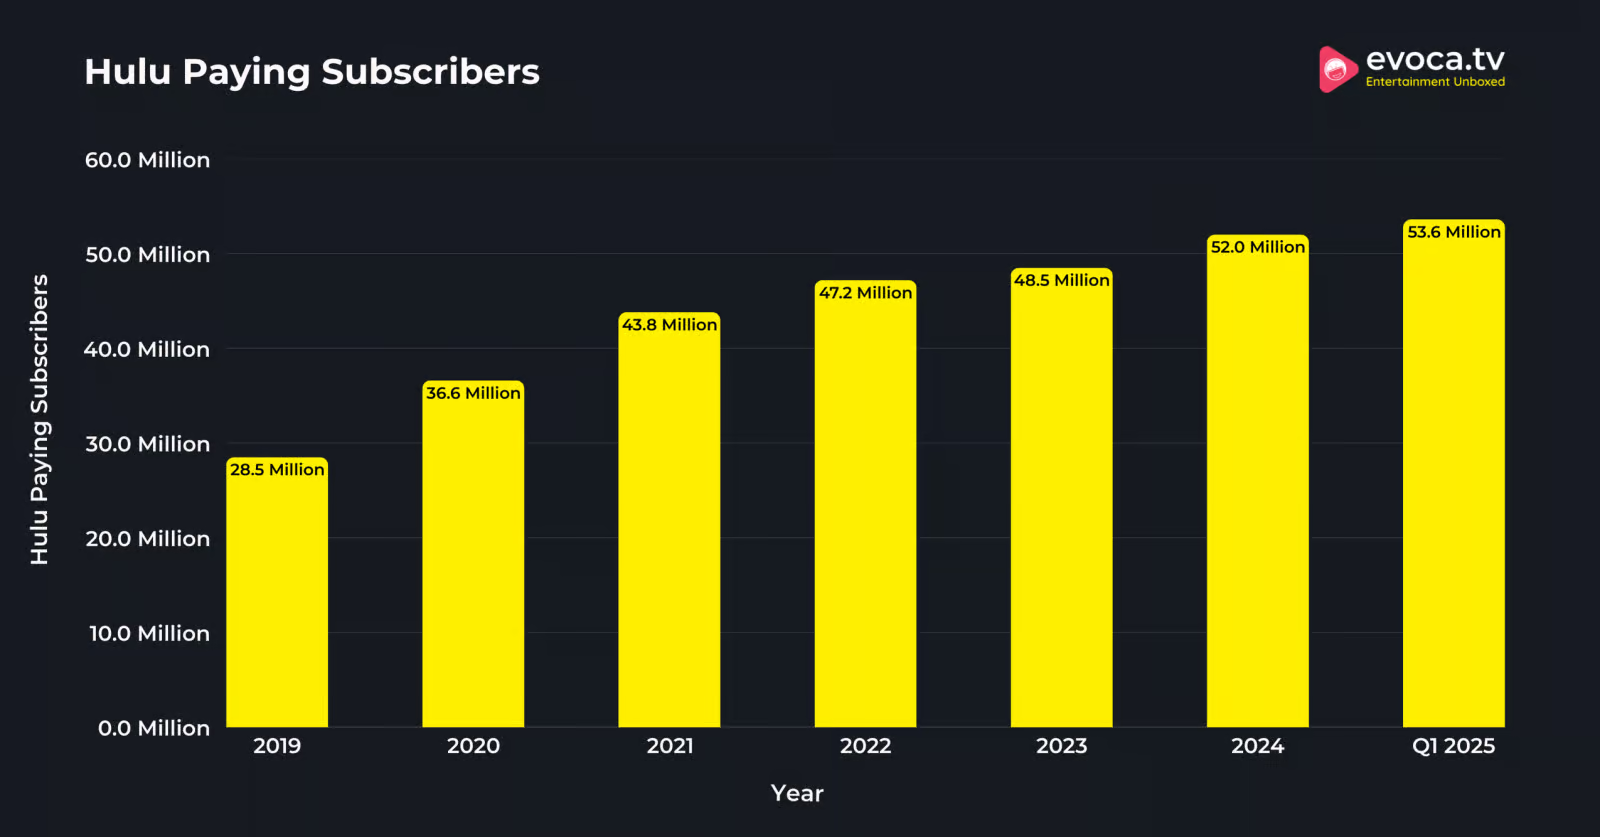
Hulu reached 53.6 million paid subscribers in the United States in 2025, and has grown by 1.6 million in a single quarter.
Let’s take a closer look at the number of Hulu subscribers, breakdown of subscribers, revenue, revenue breakdown, ARPU market share, content statistics, and more in this article.
Top Hulu Statistics
- Hulu has 53.6 million paying subscribers in the United States.
- The platform registered a revenue of $3.2 billion in Q1 2025.
- Hulu SVOD services recorded an average monthly revenue of $12.29 per paying subscriber.
- Hulu Live TV services registered a monthly average revenue per user of $93.61.
- In 2023, Hulu Live TV generated revenue of $4.8 billion, while streaming services generated $6.3 billion.
- Hulu had an 11% share of the SVOD market in the United States.
Hulu Revenue Statistics
In Q1 2025, Hulu registered a revenue of $3.2 billion.
That was a 4.12% QoQ increase in Hulu’s revenue compared to $2.84 billion generated in the last quarter of 2023.
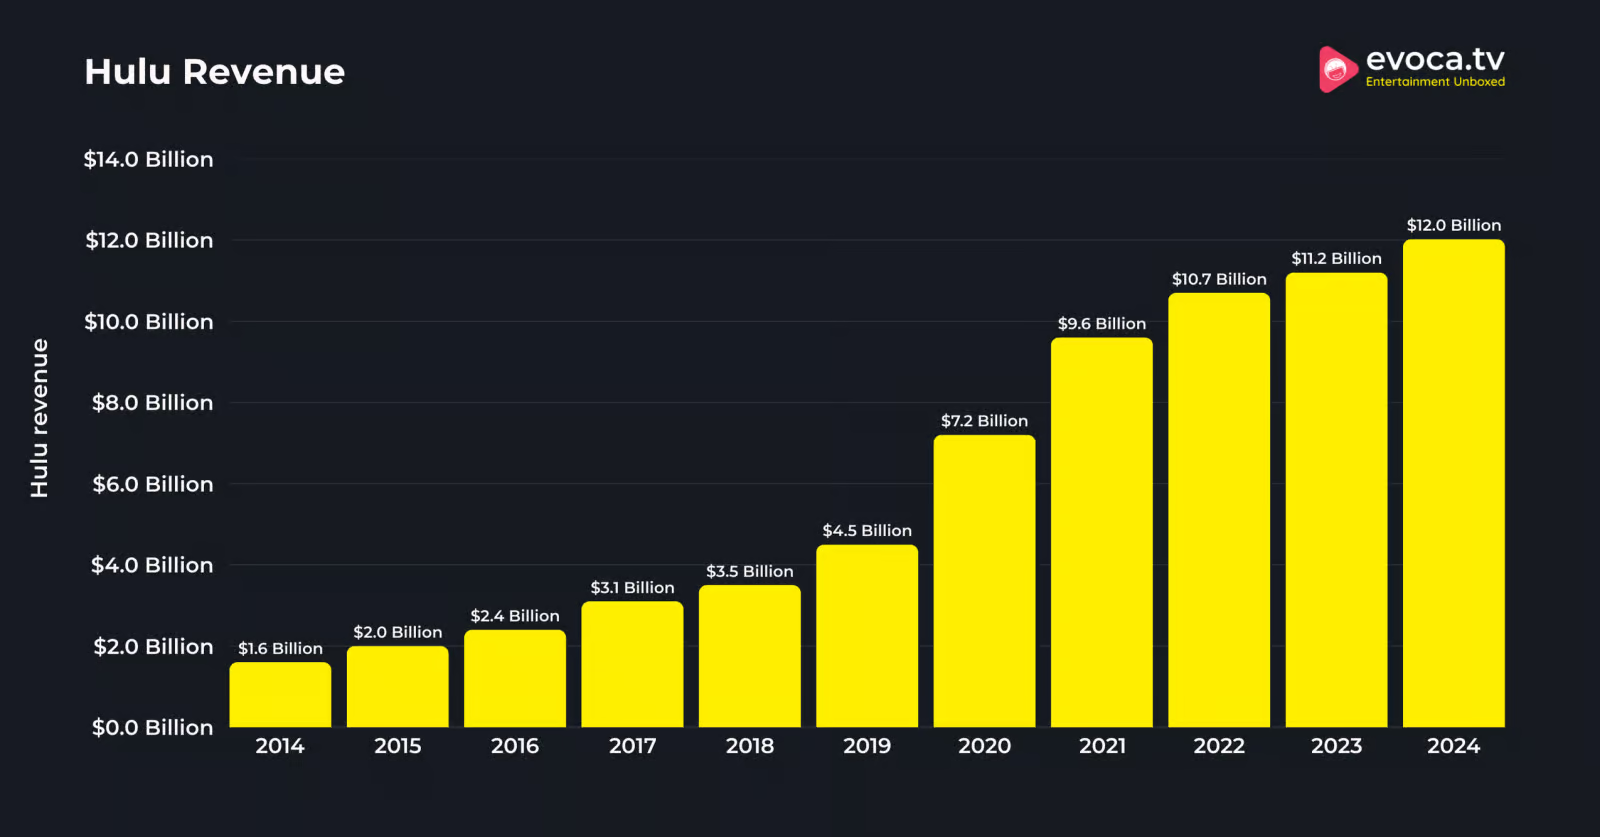
Besides, Hulu generated a revenue of $11.2 billion in 2023. That was an increase of 0.5 billion compared to revenue of $10.7 billion registered in 2022.
Further, Hulu’s revenue grew from $4.5 billion in 2019 to $11.2 billion in 2023, displaying an overall increase of $6.7 billion.

The following table displays the revenue generated by Hulu over the years.
| Year | Hulu Revenue |
|---|---|
| 2024 | $12 billion |
| 2023 | $11.2 billion |
| 2022 | $10.7 billion |
| 2021 | $9.6 billion |
| 2020 | $7.2 billion |
| 2019 | $4.5 billion |
| 2018 | $3.5 billion |
| 2017 | $3.1 billion |
| 2016 | $2.4 billion |
| 2015 | $2 billion |
| 2014 | $1.6 billion |
Source: Business of Apps.
Hulu Revenue Breakdown
In 2023, Hulu Live TV generated revenue of $4.8 billion, while streaming services generated $6.3 billion.
The revenue registered by Hulu streaming services in 2023 witnessed no growth compared to the revenue generated by the services in 2022.
On the other hand, Hulu Live TV revenue witnessed an increase of $0.4 billion in 2023 compared to the revenue of $4.4 billion recorded in 2022.
The following table shows the revenue generated by Hulu Streaming Services and Live TV recorded over the years.
| Year | Hulu Streaming Services Revenue | Hulu Live TV Revenue |
|---|---|---|
| 2023 | $6.3 billion | $4.8 billion |
| 2022 | $6.3 billion | $4.4 billion |
| 2021 | $5.8 billion | $3.7 billion |
| 2020 | $4.4 billion | $2.8 billion |
| 2019 | $3.7 billion | $1.4 billion |
Source: Business of Apps.
How Many Subscribers Does Hulu Have?
Hulu has 52 million paying subscribers in the United States.
Comparatively, in the last quarter of 2023, Hulu had 48.5 million paying subscribers in the United States. That displays a QoQ increase of 2.47% in the number of Hulu subscribers in the first quarter of 2024.
Besides, Hulu subscribers grew by just 2.75% in 2023 compared to 47.2 million subscribers recorded in 2022 and valued between $25-$27 billion.
According to the average growth rate of Hulu subscribers recorded between 2019 and 2023, the number of subscribers on the platform is estimated to surpass 55.6 million after growing by 14.65% in 2024 compared to 2023.
| Year | Hulu Paying Subscribers | YoY Growth |
|---|---|---|
| 2025 | 53.6 million | – |
| 2024 | 52 million | 7.22% |
| 2023 | 48.5 million | 2.75% |
| 2022 | 47.2 million | 7.76% |
| 2021 | 43.8 million | 19.67% |
| 2020 | 36.6 million | 28.42% |
| 2019 | 28.5 million | – |

The following table displays the number of Hulu subscribers in the United States over the past years.
| Launched On | October 29, 2007. |
| Headquarters | Los Angeles, California, U.S. |
| Parent Company | The Walt Disney Company |
| Total Paid Subscribers | 49.7 million |
| SVOD Only Subscribers | 45.1 million |
| Live TV + SVOD subscribers | 4.6 million |
| Revenue (Q1 2024) | $2.95 billion |
| Average Monthly Revenue Per User of SVOD only | $12.29 |
| Average Monthly Revenue Per User of Live TV | $93.61 |
| Hulu’s Share in the SVOD Market in the U.S. | 11% |
Source: Statista, Walt Disney.
Hulu SVOD-only Subscribers
Hulu has 45.1 million SVOD-only subscribers as of Q1 2024.
Comparatively, Hulu had 43.9 million SVOD-only subscribers in the United States in Q4 of fiscal year 2023, a 2.73% quarter-over-quarter increase.
The following table displays the SVOD-only subscribers recorded on Hulu over the years.
| Year | Number of Hulu Live TV Subscribers |
|---|---|
| 2024 (Q1) | 45.1 million |
| 2023 | 43.9 million |
| 2022 | 42.8 million |
| 2021 | 39.7 million |
| 2020 | 32.5 million |
Source: Walt Disney, Walt Disney, Walt Disney.
Hulu Live TV + SVOD Subscribers
Hulu Live TV has 4.6 million subscribers as of Q1 2024.
The number of Hulu’s Live TV subscribers has not changed since the last quarter of 2023, displaying a 0% increase.
According to Statista, Hulu TV was the second most popular online TV service in the United States, with 4.6 million subscribers in 2023. At the same time, YouTube TV was the most popular TV service, with 7.9 million subscribers.
Besides, the number of Hulu Live TV+ SVOD subscribers grew by just 0.6 million between 2021 and 2024.
The following table displays the number of Hulu Live TV subscribers in the United States recorded over the years.
| Year | Number of Hulu Live TV Subscribers |
|---|---|
| 2024 (Q1) | 4.6 million |
| 2023 | 4.6 million |
| 2022 | 4.4 million |
| 2021 | 4.0 million |
| 2020 | 4.1 million |
Source: Walt Disney, Statista
Hulu SVOD Services ARPU
Hulu SVOD services recorded an average monthly revenue of $12.29 per paying subscriber.
Comparatively, in the last quarter of 2023, Hulu’s streaming services recorded a monthly ARPU of $12.11, and in Q4 2022, the monthly ARPU registered was $12.23.
The following table displays the average monthly revenue generated per paying subscriber of Hulu streaming services in the United States.
| Year | Hulu’s Monthly ARPU of SVOD Services |
|---|---|
| Q1 2024 | $12.29 |
| Q4 2023 | $12.11 |
| Q3 2023 | $12.39 |
| Q2 2023 | $11.73 |
| Q1 2023 | $12.46 |
| Q4 2022 | $12.23 |
| Q3 2022 | $12.92 |
| Q2 2022 | $12.77 |
| Q1 2022 | $12.96 |
| Q4 2021 | $12.75 |
Source: Statista, Walt Disney.
Hulu Live TV + SVOD Services Monthly ARPU
Hulu Live TV + SVOD services registered a monthly average revenue per user of $93.61.
This was an increase of $2.81 in the monthly ARPU of Hulu’s Live TV + SVOD services in Q1 2024 compared to the previous quarter.
In Q4 2023, Hulu’s Live TV + SVOD services generated $90.08 per paying subscriber, an increase of $4.03 compared to the average monthly revenue of $86.77 per paying subscriber recorded in Q4 2022.
The following table displays the average monthly revenue per paying subscriber of Hulu Live TV + SVOD services in the United States.
| Year | Hulu’s Monthly ARPU of Live TV + SVOD Services |
|---|---|
| Q1 2024 | $93.61 |
| Q4 2023 | $90.08 |
| Q3 2023 | $91.8 |
| Q2 2023 | $92.32 |
| Q1 2023 | $87.9 |
| Q4 2022 | $86.77 |
| Q3 2022 | $87.92 |
| Q2 2022 | $88.77 |
| Q1 2022 | $87.01 |
| Q4 2021 | $84.89 |
Source: Statista, Walt Disney.
Hulu Market Share
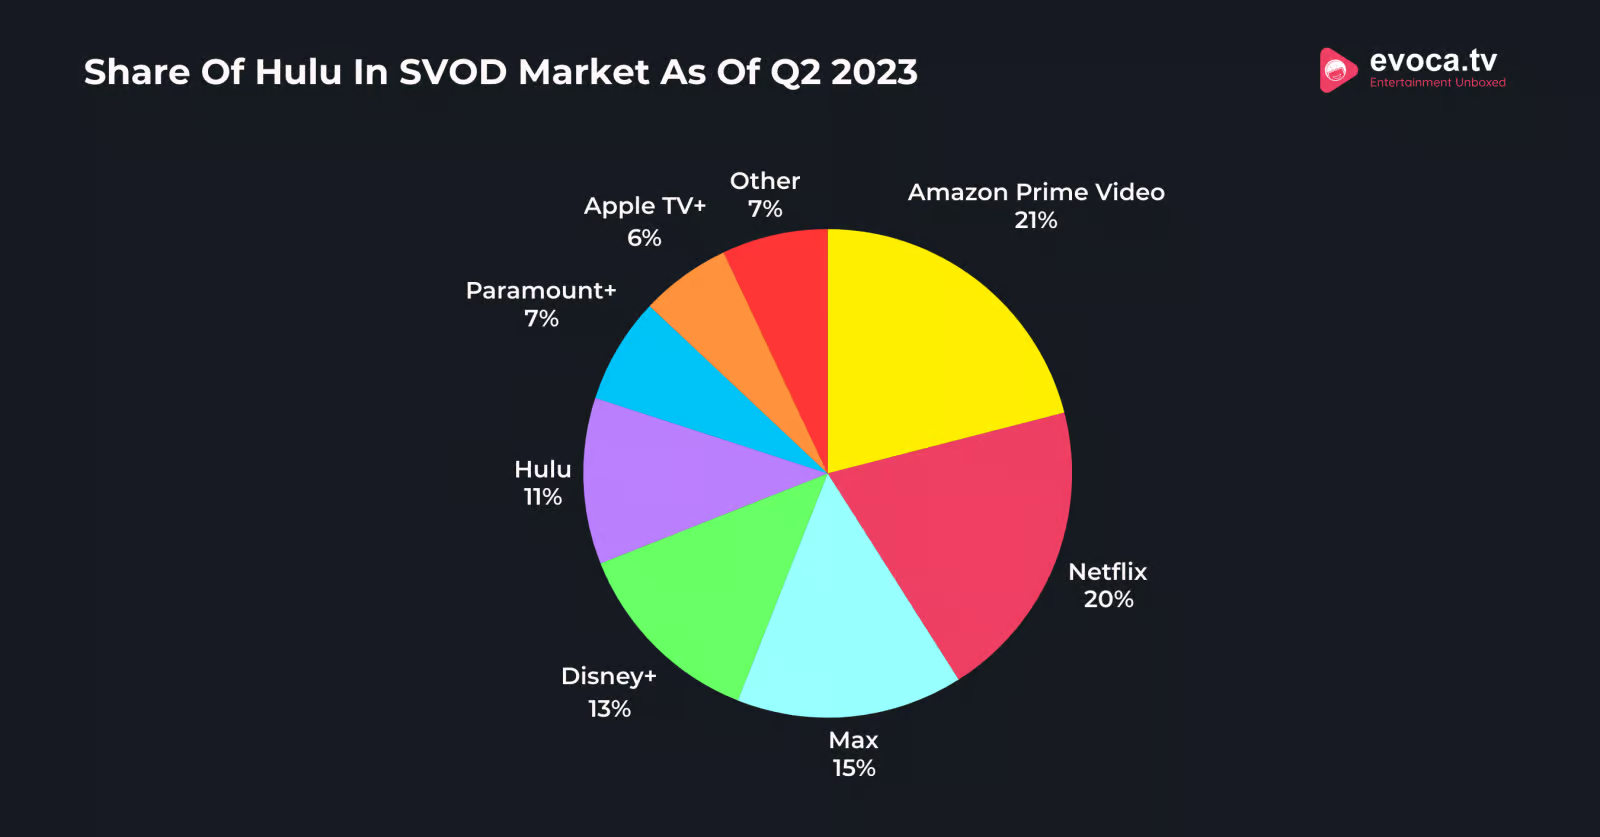
Hulu had an 11% share of the SVOD market in the United States.
This makes Hulu 5th most preferred SVOD platform in the country.
With 21% of the market share, Amazon Prime Video was the most preferred streaming platform in the United States. Meanwhile, Netflix was the second most preferred SVOD platform, with 20% of the market share.

The following table displays the share of the top SVOD platforms in the United States.
| SVOD Platform | Market Share of the Platform |
|---|---|
| Amazon Prime Video | 21% |
| Netflix | 20% |
| Max | 15% |
| Disney+ | 13% |
| Hulu | 11% |
| Paramount+ | 7% |
| Apple TV+ | 6% |
| Other | 7% |
Source: Statista.
Hulu Content Statistics
Hulu with Live TV has 75 channels.
The service offers major channels like ABC, CBS, NBC, Fox, Discovery Channel, etc.
Hulu has the second-highest number of channels among the vMVPD services in the United States, while YouTube TV offers 78 channels, the highest number of channels offered by any vMVPD service in the country.
The following table displays the channels available on the selected vMVPD services as of February 2024.
| vMVPD Services in the United States | Number of Channels |
|---|---|
| YouTube TV | 78 |
| Hulu with Live TV | 75 |
| DirectTV Stream | 62 |
| Fubo | 56 |
| Philo | 42 |
| Sling Blue | 35 |
| Sling Orange | 24 |
Source: Statista.
Hulu had nearly 900 quality-rated TV shows.
Of these, 264 TV shows were rated 7.5+ on IMDb, and 634 were rated 6.5+ on IMDb. Meanwhile, 801 TV shows on the Pltafoem were rated below 6.5 on IMDb.
Hence, there were nearly 1700 TV shows on Hulu as of May 2023.
Source: Statista.
Hulu had 587 quality-rated movies in May 2023.
Of these, 505 movies were rated over 6.5 on IMDb with over 300 votes, while 82 were rated over 7.5.
At the same time, 610 movies available on the platform were rated below 6.5.
Source: Statista.
Miscellaneous Hulu Statistics
- 37% of the Hulu subscribers use the platform daily.
- On average, a Hulu viewer spends 89 minutes per day on the platform, viewing content.
- Hulu Ads are 150% more effective compared to regular TV ads.
- Hulu ads are 200% more effective in creating brand awareness.
- The ads on the platform have proven to be 24% better at creating a purchasing intent.
- Over half of the Hulu subscribers are either GenZ or Millennials.
Source: Wordstream, Gitnux, Backlinko.
Related Post
Conclusion: Hulu Has 53.6 Million Paying Subscribers in US in 2025
The number of Hulu subscribers has been growing consistently in the United States. Between 2019 and 2025, Hulu subscribers witnessed an overall growth of 88.07%.
The majority of the growth comes from the SVOD subscribers on the platform, while the number of Live TV + SVOD subscribers on the platform has remained stagnant since 2021.
Further, according to our estimates, we expect Hulu subscribers to surpass 55.6 million by the end of 2025 after growing by 14.65% compared to the subscribers recorded in 2023.
