Launched in 2020, Peacock quickly became a big name in the video streaming industry.
Peacock currently boasts 31 million paying subscribers and is expected to have 84.2 million subscribers by 2026.
The video streaming platform generated $3.3 billion in revenue in 2023 and crossed the $1 billion quarterly revenue in the fourth quarter of 2023.
In this article, I have compiled the most significant statistics about Peacock subscribers, revenue, and traffic.
Top Peacock Statistics for 2024
- Peacock has over 31 million paying subscribers as of 2024.
- 77% of Peacock subscribers use an Ad-Supported plan.
- Peacock generated more than $3.3 billion in revenue in 2023.
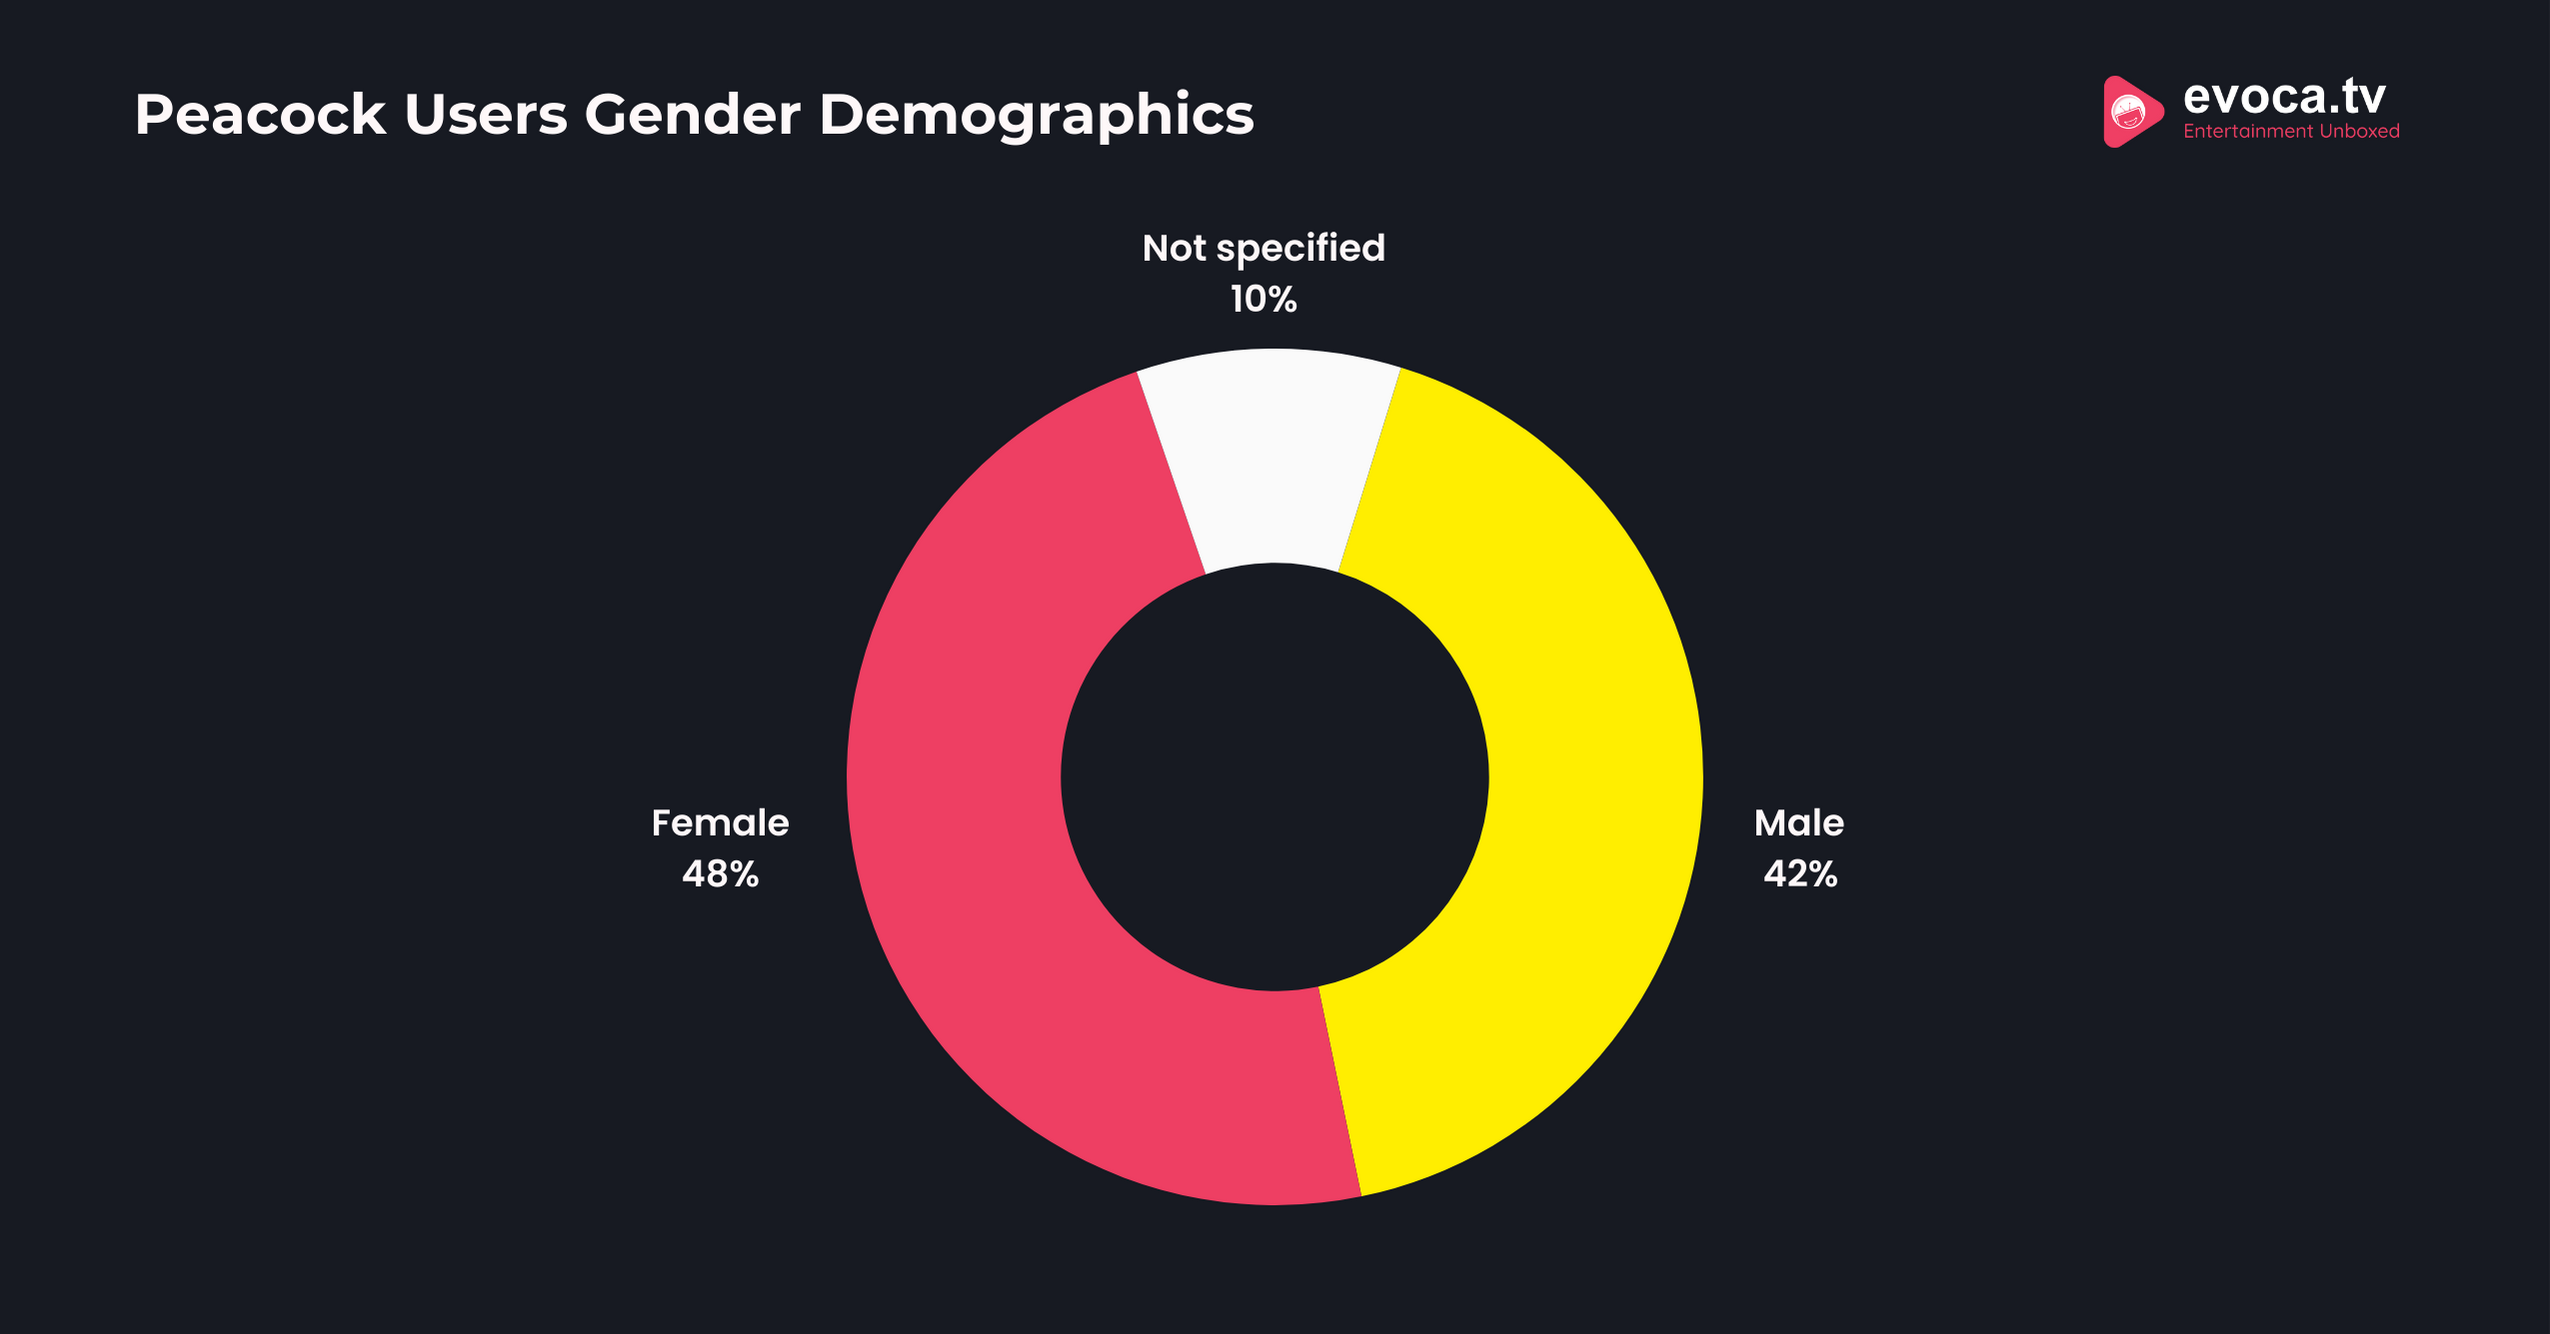
- 53.08% of Peacock users are female and 46.92% are males.
- Peacock will generate ad revenue worth $2.7 billion by 2026.
Peacock Subscribers Statistics
Peacock is a reliable streaming service with a large user base in the United States.
However, the user base is growing, and in 2024, Peacock will be used in other major countries and regions.
This section will cover statistics about Peacock users and subscribers.
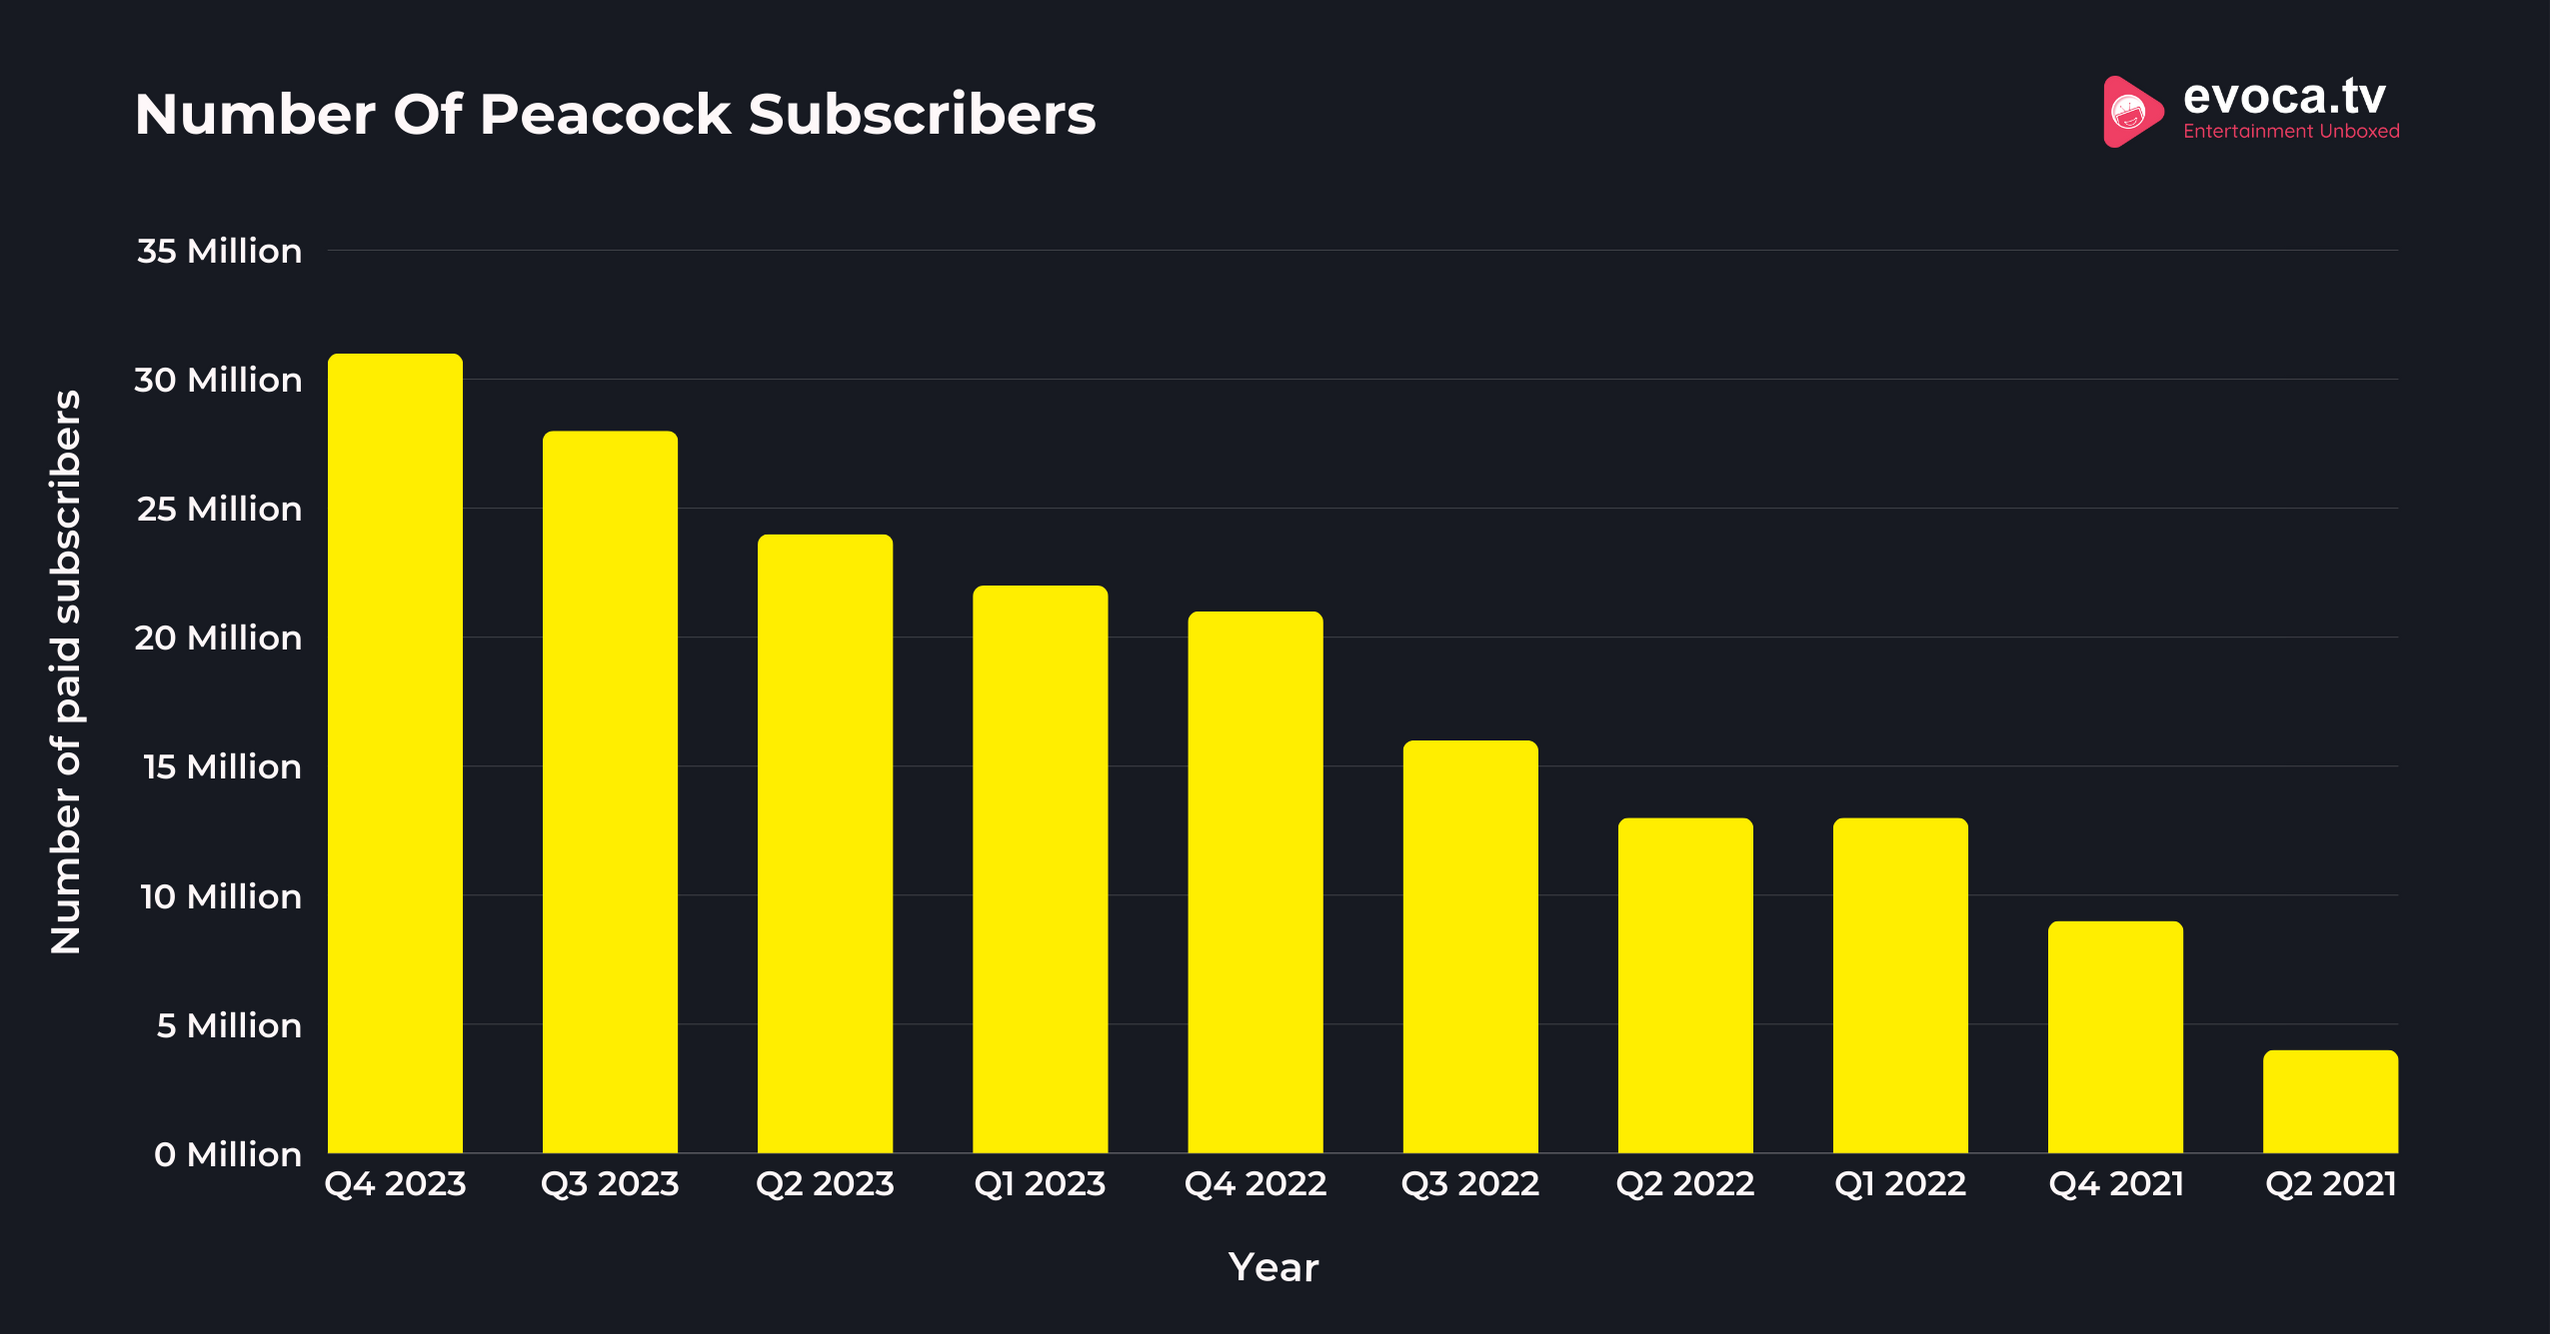
Peacock Has 31 Million Paid Subscribers In The U.S. As Of Q4 2023
This represents an increase of around 10 million subscribers from Q4 2022. There were about 21 million paid Peacock subscribers in the U.S. in Q4 2022.
The number of paid Peacock subscribers was around 9 million during Q4 2021.

Here is a table showing the number of paid Peacock subscribers in the U.S. by quarter:
| Year | Number Of Paid Subscribers |
|---|---|
| Q4 2023 | 31 million |
| Q3 2023 | 28 million |
| Q2 2023 | 24 million |
| Q1 2023 | 22 million |
| Q4 2022 | 21 million |
| Q3 2022 | 16 million |
| Q2 2022 | 13 million |
| Q1 2022 | 13 million |
| Q4 2021 | 9 million |
| Q2 2021 | 4 million |
Source: Statista
Peacock Is Expected To Have Over 84.2 Million Subscribers By 2026
There were nearly 23.1 million Peacock subscribers in 2020, almost doubling in 2021, reaching 51.5 million.
Estimates suggest that the number of Peacock subscribers in the U.S. will grow to over 76 million in 2024.
Moreover, Peacock subscribers are projected to reach 80.6 million in 2025.
Here is a table with the estimated number of Peacock subscribers in the U.S.:
| Year | Number Of Subscribers |
|---|---|
| 2026* | 84.2 million |
| 2025* | 80.6 million |
| 2024* | 76 million |
| 2023* | 70.7 million |
| 2022* | 64.3 million |
| 2021 | 51.5 million |
| 2020 | 23.1 million |
Source: Statista
77% Of Peacock Subscribers Use Ad-Supported Plan
Meanwhile, 23% of Peacock subscribers in the United States use the ad-free plan.
55% of Hulu subscribers use ad-supported plans, and 45% use ad-free plans.
On the other hand, 93% of Netflix subscribers use ad-free plans, while only 7% of subscribers use ad-supported plans in the U.S.
The table below shows the distribution of subscribers of video streaming services in the U.S by plan:
| Streaming Platform | Ad-Supported Plan Users | Ad-Free Plan Users |
|---|---|---|
| Peacock | 77% | 23% |
| Hulu | 55% | 45% |
| Discovery+ | 45% | 55% |
| Paramount+ | 37% | 63% |
| Max | 19% | 81% |
| Disney+ | 19% | 81% |
| Netflix | 7% | 93% |
Source: Statista
12% Of Millennials Reported Using Peacock Premium A Few Times A Week In 2022
8% of Gen Z Peacock Premium users reported using the platform a few times per week.
Around 6% of Millennials used Peacock Premium once daily, and 4% of Gen Z did the same.
On the other hand, 7% of millennials reported using Peacock Premium multiple times a day.
59% of Gen Z and 69% of Gen X reported never using the Peacock Premium in 2022.
Here is a table showing the frequency of using Peacock Premium in the U.S. by generation:
| Generation | Multiple Times A Day | Once Daily | A Few Times Per Week | Never |
|---|---|---|---|---|
| Gen Z | 7% | 4% | 8% | 59% |
| Millennials | 7% | 6% | 12% | 59% |
| Gen X | 5% | 5% | 11% | 69% |
| Baby Boomers | 2% | 1% | 5% | 82% |
Source: Statista
Peacock Was Used By 27% Of U.S Households In 2022
This means that almost 3 in every 10 U.S. households were using Peacock in 2022.
Netflix had the highest SVOD penetration rate of 78% in the U.S. in 2022.
Amazon Prime Video had a 72% penetration rate, while Hulu had a 50% penetration rate in the U.S.
The table below shows the penetration rate of top SVOD platforms in the U.S. 2022:
| Platform | Penetration Rate |
|---|---|
| Netflix | 78% |
| Amazon Prime Video | 72% |
| Hulu | 50% |
| Disney+ | 47% |
| HBO Max | 36% |
| Peacock | 27% |
| Paramount+ | 25% |
| Apple TV+ | 19% |
| Discovery+ | 9% |
| Refused | 2% |
Source: Statista
Peacock User Demographics
Peacock has attracted and retained a significant and diverse user base in the U.S.
However, their vision is expanding, and Peacock is also being made available to users from other countries.
In this section, we will find out about the age and gender demographics of Peacock users.
Peacock Was Used By 48% Of Females And 42% Of Males As Of 2021
Females currently use the VOD platform more than males. The gender gap is closing, and there is not much difference between the ratio of male and female users.
According to Statista’s 2021 study, 48% of males and 42% of females used Peacock.

At the same time, Amazon Prime Video was used by 47% of males and 53% of females in 2021.
The table below shows the gender split of VOD users in the U.S. on top platforms in 2021.
| Platform | Male Users | Female Users |
|---|---|---|
| Peacock | 48% | 42% |
| Netflix | 48% | 52% |
| HBO Max | 61% | 39% |
| Amazon Prime Video | 47% | 53% |
| Apple TV+ | 57% | 43% |
| Hulu | 48% | 52% |
| Disney+ | 52% | 48% |
Source: Statista
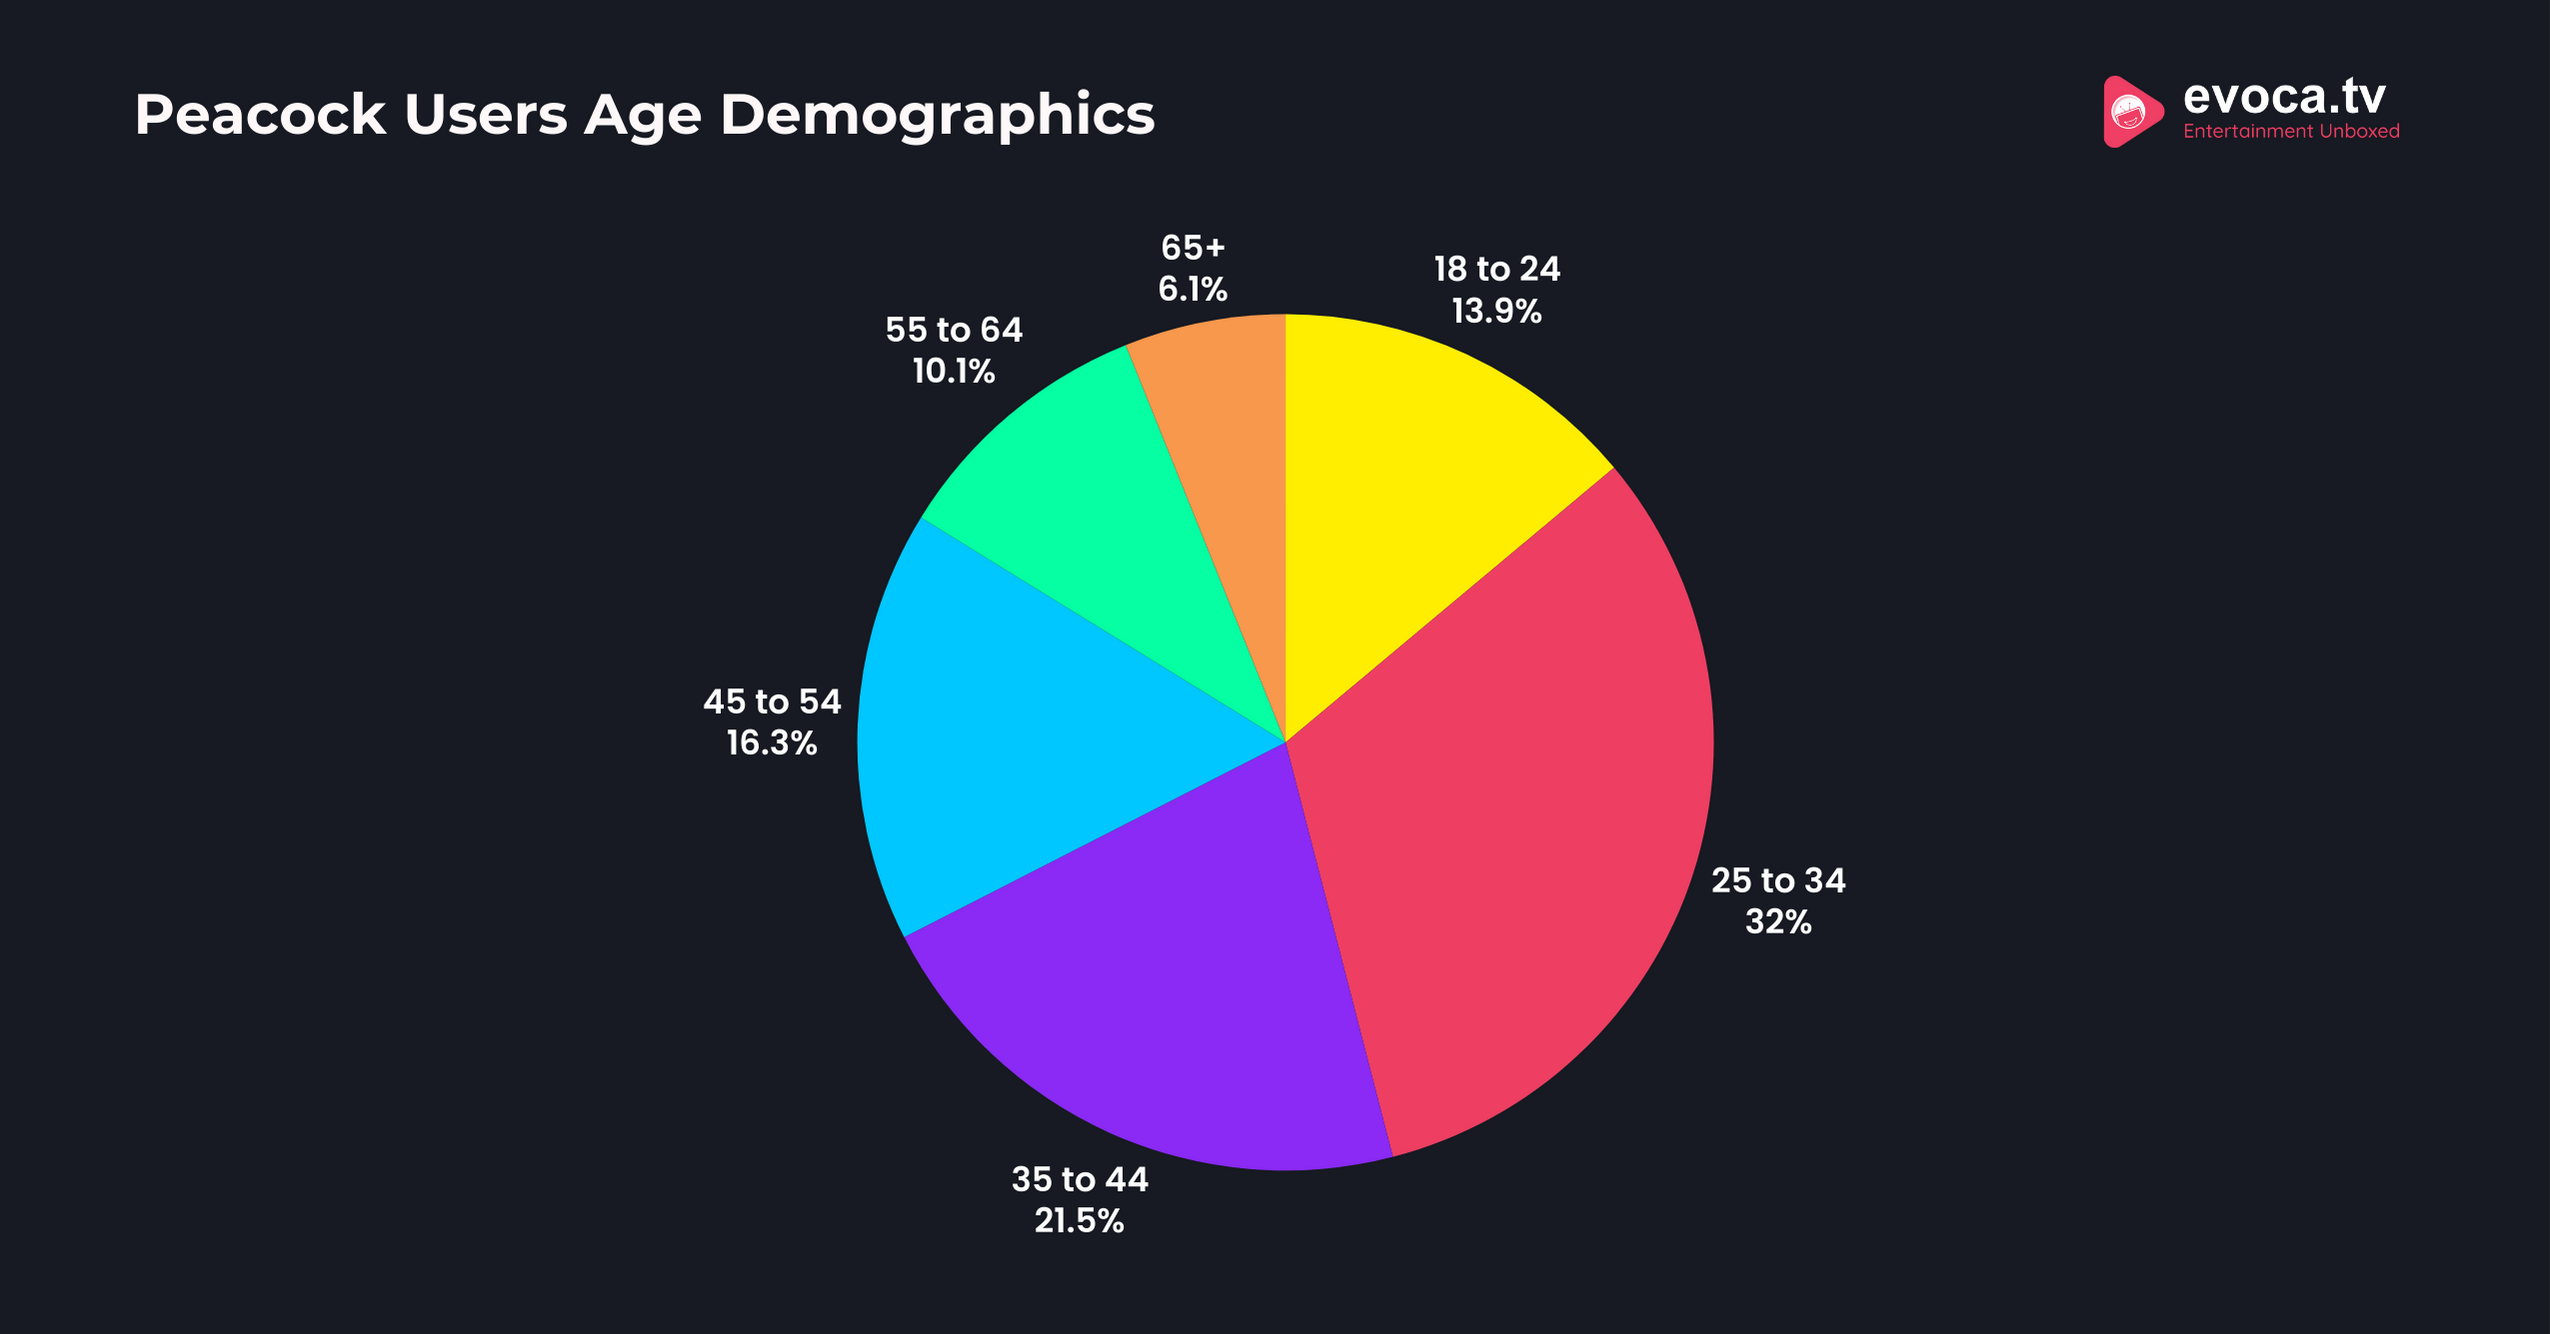
32.05% Of Peacock Visitors Are Aged 25-34 Years As Of April 2024
This represents the largest age group that uses the Peacock streaming platform.
Around 13.92% of Peacock visitors are between 18 and 24 years old, while 21.52% are aged 35 to 44.
In addition, about 16.31% of Peacock visitors are from the 45 to 54 age group.

The table below shows the age demographics of Peacock users as of April 2024:
| Age Group | Peacock Visitor |
|---|---|
| 18 to 24 | 13.92% |
| 25 to 34 | 32.05% |
| 35 to 44 | 21.52% |
| 45 to 54 | 16.31% |
| 55 to 64 | 10.12% |
| 65+ | 6.09% |
Source: Similarweb
Peacock Revenue Statistics
Let us explore some financial statistics about Peacock’s streaming service.
Peacock Generated Over $3.3 Billion Revenue In 2023
Peacock’s revenue crossed the $1 billion mark in the fourth quarter of 2023, a first-time achievement for the platform since its launch.
Peacock amassed around $2.1 billion in revenue in 2022, up by more than 170% from the prior year.
The streaming platform’s revenue was around $778 million in 2021.
The table below shows the revenue of Peacock over the past few years since its launch:
| Year | Revenue |
|---|---|
| 2023 | $3.3 billion |
| 2022 | $2.1 billion |
| 2021 | $778 million |
| 2020 | $118 million |
Source: Comcast
Peacock’s Ad Revenue Has An Expected CAGR Of 23% Between 2022 And 2026
In comparison, Netflix is expected to exhibit the highest ad-revenue growth with a compound annual growth rate of 39.3% between 2022 and 2026.
Disney Plus is projected to grow at 25.3% CAGR, while Warner Bros. Discovery is expected to grow at a 22% CAGR.
The table below shows the projected CAGR of top video streaming platforms between 2022 and 2026:
| Streaming Platform | Expected CAGR |
|---|---|
| Netflix | 39.3% |
| Disney Plus | 25.3% |
| Peacock | 23% |
| Discovery+ | 22% |
| Tubi | 21% |
| The Roku Channel | 17% |
| Pluto TV | 12% |
| Hulu | 10% |
Source: Statista
Peacock Is Expected To Generate $2.7 Billion In Ad Revenue By 2026
On the other hand, Hulu is projected to generate the highest ad revenue of $5 billion by 2026.
The estimates suggest that Netflix will generate $1.7 billion and Pluto TV will generate 1.5 billion ad revenue by 2026.
The table below shows the expected ad revenue of top ad-supported video streaming services in the U.S. by 2026:
| Platform | Expected Ad Revenue |
|---|---|
| Hulu | $5 billion |
| Peacock | $2.7 billion |
| Netflix | $1.7 billion |
| Pluto TV | $1.5 billion |
| Disney Plus | $1.4 billion |
| The Roku Channel | $1.3 billion |
| Tubi | $1.1 billion |
| Paramount Plus | $1.1 billion |
| Warner Bros. Discovery | $0.8 billion |
Source: Statista
General Peacock Statistics
In this section, let us explore some general statistics about the Peacock streaming service.
Peacock Has A 1.3% Share Of U.S. TV Screen Time
As of December 2023, nearly 36% of video content was viewed through streaming, while 28.2% was viewed through cable.
YouTube has an 8.5% share of U.S. TV screen time, the largest share in the country.
Netflix follows with a 7.7% share, and Prime Video has 3.3% screen time in the U.S.
Here is a table showing the screen timeshare of video streaming platforms in the U.S.:
| Platform | Screen Timeshare |
|---|---|
| YouTube | 8.5% |
| Netflix | 7.7% |
| Amazon Prime Video | 3.3% |
| Hulu | 2.6% |
| Disney Plus | 1.9% |
| Tubi | 1.4% |
| Peacock | 1.3% |
| HBO Max | 1.2% |
| Roku Channel | 1% |
| Pluto TV | 0.7% |
Source: Nielsen
83.59% Of Traffic To Peacock’s Website Comes From Direct Sources
About 74.09% of Peacock traffic is organic, while 25.91% is paid traffic.
Further, 8.91% of traffic comes through organic search, and 3.12% comes from paid search.
Around 1.17% of traffic is through referrals, and 1.6% is from social platforms.
The table below shows the traffic sources of Peacock’s website as of April 2024:
| Source Of Traffic | Proportion |
|---|---|
| Direct | 83.59% |
| Organic search | 8.91% |
| Paid search | 3.12% |
| Social | 1.6% |
| Referrals | 1.17% |
| 1.12% | |
| Display | 0.5% |
Source: Similarweb
98.17% Of All Peacock Traffic Comes From The U.S.
Puerto Rico is responsible for 0.37% of traffic to the Peacock’s website.
0.21% of web traffic comes from the United Kingdom, while 0.15% comes from Canada.
Moreover, 0.07% of the traffic to Peacock comes from India.
Source: Similarweb
There Are Over 3,950 Movies On Peacock U.S. As Of October 2023
2,683 movies were streaming on Peacock in 2022, and only 759 movies in 2021.
Comparatively, Prime Video has more than 12,071 movies, and Netflix has 3,977 movies as of 2023.
With around 14,670 movies, Amazon Prime Video had the highest number of movies in 2021.
Here is a table showing the number of movies on top U.S. streaming platforms in 2023 and 2021:
| Platform | Number Of Movies In 2023 | Number Of Movies In 2022 |
|---|---|---|
| Peacock | 3,950 | 2,683 |
| Prime Video | 12,071 | 10,285 |
| Netflix | 3,977 | 3,921 |
| Hulu | 2,419 | 1,209 |
| Max | 2,168 | 2,558 |
| Disney+ | 1,400 | 1,246 |
Source: Statista
Peacock Premium Costs $5.99 Per Month (With Ads)
Subscribers can also get the Peacock Premium Plan at $59.99 per year plus taxes.
With Peacock Premium, subscribers can access Peacock’s original shows and a library of classic movies and TV series.
Users can also opt for the Peacock Premium Plus plan, which offers content with few ads for an additional $6 / month.
In comparison, Netflix offers its premium plan for $22.99 per month, which includes unlimited ad-free movies and TV shows.
Related Read:
Conclusion: Peacock’s Subscriber Base Reaches 31 Million Milestone
Peacock is one of the newest video streaming platforms, attracting millions of subscribers quickly.
With the popularity of VOD services among Gen Z and Millennials, almost 46% of Peacock users are between 18 and 34 years old.
As the VOD landscape progresses, Peacock is set to increase its user base to an estimated 76 million by the end of 2024.
These were the most striking statistics regarding Peacock subscribers, revenue, and traffic.