Adults and teens globally all have reached an average screen time that is quite alarming. On average a resident spends 1/4th of their day i.e over 6 hours 40 minutes facing a screen. That is equivalent to the time that some people sleep in the night!
The average daily screen time of people worldwide peaked in the years 2020 and 2021, when the pandemic hit the world, forcing people to stay indoors. However, that’s just 10 minutes more than people’s current screen time of 6 hours and 40 minutes.
Furthermore, with the increased adoption of AI, digitalization, and the latest technology, screen time is estimated to increase further in the upcoming years. Let’s take a look at the current statistics about the average screen time worldwide, in the United States and other countries worldwide.
Screen Time Statistics – At A Glance
- People spend an average of 6 hours and 40 minutes daily on their screens.
- The average time spent on screens in the United States is 7 hours and 3 minutes.
- On average, teens spend 8 hours and 39 minutes on their screens worldwide.
- Teens spend 3 hours and 16 minutes of screen time on TV and Video games.
- South African people spend the highest amount of time on their screen, 9 hours 24 minutes.
- Japanese people spend an average of just 3 hours and 56 minutes daily on their screens, the lowest compared to other countries.
Average Daily Screen Time Worldwide
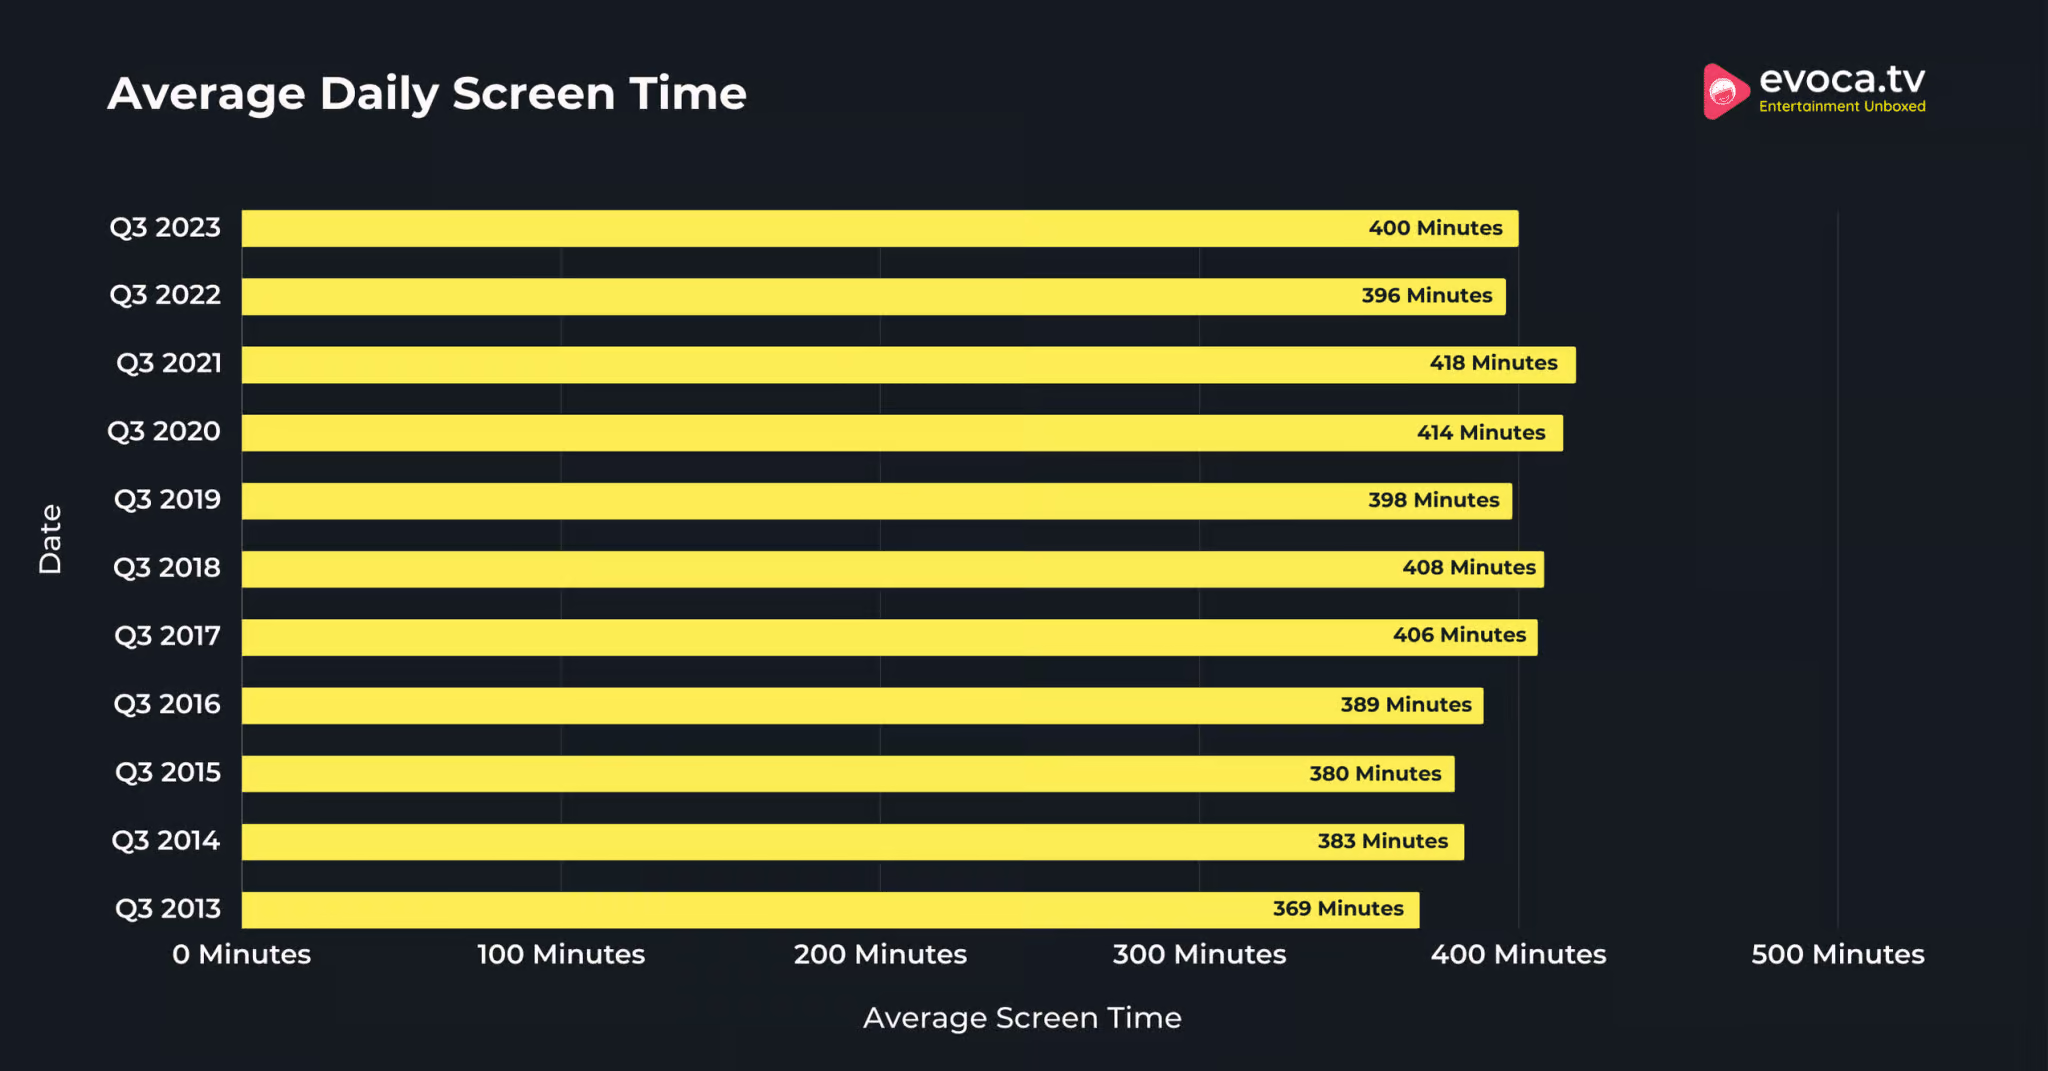
The daily average screen time of people worldwide is 6 hours 40 minutes.
Looking back comparatively, users spent 6 hours and 36 minutes on their screens connected to the internet in 2022. That displays an increase of 4 minutes in the daily screen time of adults worldwide.
The average daily screen time of adults worldwide reached a peak in Q3 2021 when they spent 6 hours and 58 minutes daily on their screens.
However, the average time spent on screen dropped by 22 minutes between Q3 2021 and Q3 2022.

Here is a table displaying the average screen time of the users connected to the internet recorded over the past years:
| Date | Average Screen Time |
|---|---|
| Q3 2023 | 6 hours 40 minutes |
| Q3 2022 | 6 hours 36 minutes |
| Q3 2021 | 6 hours 58 minutes |
| Q3 2020 | 6 hours 54 minutes |
| Q3 2019 | 6 hours 38 minutes |
| Q3 2018 | 6 hours 48 minutes |
| Q3 2017 | 6 hours 46 minutes |
| Q3 2016 | 6 hours 29 minutes |
| Q3 2015 | 6 hours 20 minutes |
| Q3 2014 | 6 hours 23 minutes |
| Q3 2013 | 6 hours 9 minutes |
Source: Data Reortal
Average Screen Time US
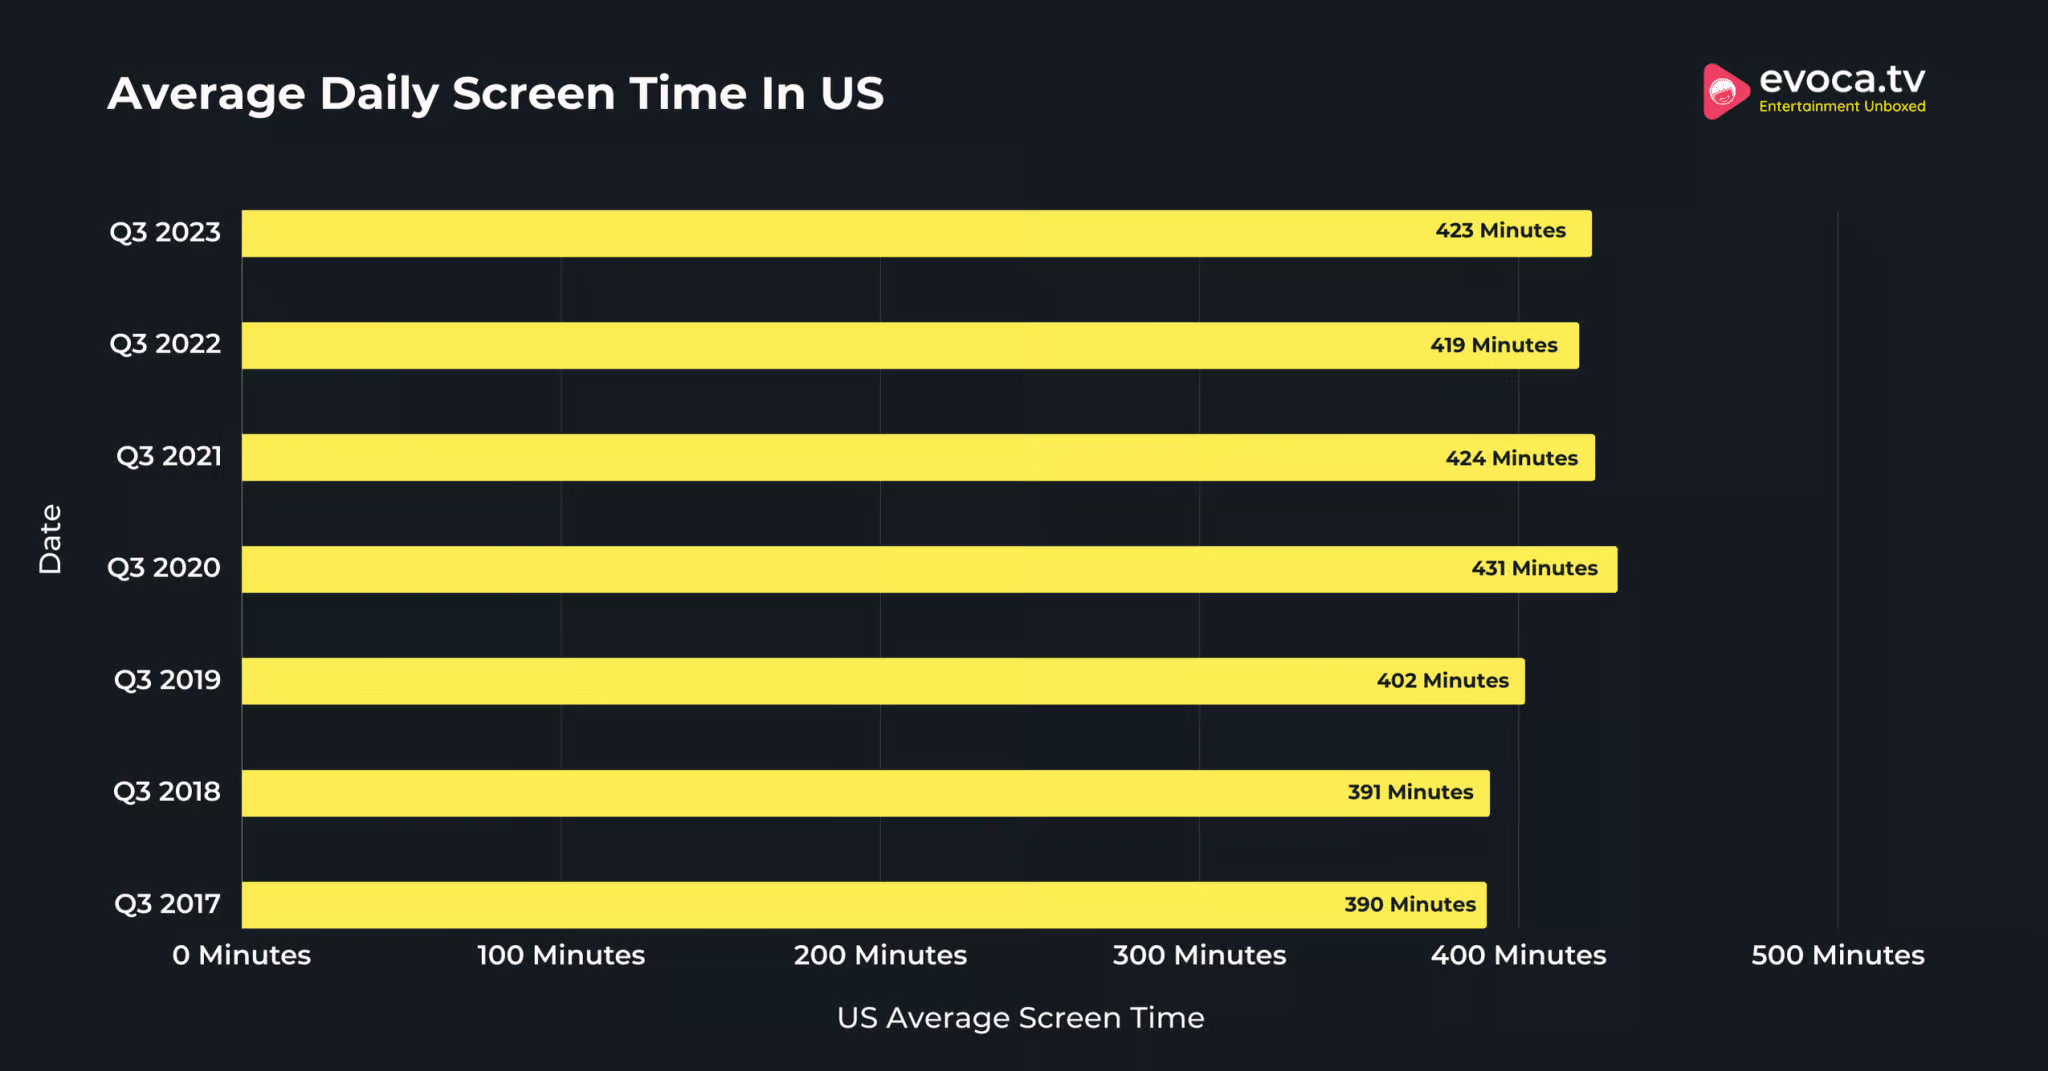
On average, adults in the United States spend 7 hours and 3 minutes on their screens.
Meanwhile, in Q3 2022, adults in the United States spent an average of 6 hours and 59 minutes on the screens.
That displays an increase of 4 minutes in the average daily screen time in the United States as of Q3 2023 compared to Q2 2022.

The following table displays the average time spent by US adults on their screens connected to the internet.
| Date | US Average Screen Time |
|---|---|
| Q3 2023 | 7 hours 3 minutes |
| Q3 2022 | 6 hours 59 minutes |
| Q3 2021 | 7 hours 4 minutes |
| Q3 2020 | 7 hours 11 minutes |
| Q3 2019 | 6 hours 42 minutes |
| Q3 2018 | 6 hours 31 minutes |
| Q3 2017 | 6 hours 30 minutes |
Source: Data Reportal
On average, people in the United States spend an average of 32 hours and 18 minutes on TV every week.
According to the latest data from Nielsen, adults in the United States spend an average of 59 hours and 56 minutes on media per week.
When broken down, it amounts to 8 hours and 34 minutes per day.
Of that, users spend an average of 42 minutes on the internet on the computer. And 2 hours 21 minutes on their smartphone.
The following table displays the breakdown of the weekly time spent by adults in the United States on media.
| Media | Weekly Screen Time | Daily Screen Time |
|---|---|---|
| Total use of TV | 32 hours 18 minutes | 4 hours 37 minutes |
| Internet on a computer | 4 hours 56 minutes | 42 minutes |
| Video on a computer | 1 hour 59 minutes | 17 minutes |
| App/web on a smartphone | 16 hours 24 minutes | 2 hours 21 minutes |
| App/web on a tablet | 4 hours 19 minutes | 37 minutes |
| Total | 59 hours 56 minutes | 8 hours 34 minutes |
Source: Nielsen
Average Daily Screen Time By Age & Gender
On average, women aged 16 to 24 years spend the most time on screen, 7 hours and 32 minutes.
On the other hand, men aged 25 to 34 years spend the most time on their screens. On average, they spend 7 hours and 13 minutes on their screen.
Conversely, men and women aged 55 to 64 years spend the lowest time on their screens. Women in this age group spend 5 hours and 17 minutes every day on their screens, and men in the age group spend 5 hours and 14 minutes on their screens.
Here is a table displaying the screen time of men and women by their age:
| Age Group | Women Screen Time | Men Screen Time |
|---|---|---|
| 16 to 24 years | 7 hours 32 minutes | 7 hours 7 minutes |
| 25 to 34 years | 7 hours 3 minutes | 7 hours 13 minutes |
| 35 to 44 years | 6 hours 25 minutes | 6 hours 40 minutes |
| 45 to 54 years | 6 hours 9 minutes | 6 hours 5 minutes |
| 55 to 64 years | 5 hours 17 minutes | 5 hours 14 minutes |
Source: Backlinko
Average Screen Time For Teens
The average screen time of teens is 8 hours and 39 minutes.
According to the latest data recorded in 2021, the average time teens spent every day on screens was 8 hrs and 39 minutes. Comparatively, in 2019, teens spent an average of 7 hours and 22 minutes on their screens.
At the same time, tweens spent 5 hrs 33 mins on their screens. Besides, the screen time of teens increased by 29.75% between 2015 and 2021.
The following table displays the average screen time of teens and tweens by year.
| Year | Teens (13-18) | Tweens (8-12) |
|---|---|---|
| 2015 | 6 hrs 40 mins | 4 hrs 36 mins |
| 2019 | 7 hrs 22 mins | 4 hrs 44 mins |
| 2021 | 8 hrs 39 mins | 5 hrs 33 mins |
| Change Since 2015 | 29.75% | 20.65% |
Source: Common Sense Media
Teens spend most of their screen time on TV and videos, 3 hours and 16 minutes.
The second highest screen time is spent on gaming, at 1 hour and 46 minutes, while the third and fourth highest screen time is spent on social media and browsing by teens.
The following table displays the average screen time teens spend on different activities.
| Activity | Average Time Spent On Screen |
|---|---|
| TV and Videos | 3 hours 16 minutes |
| Gaming | 1 hour 46 minutes |
| Social media | 1 hour 27 minutes |
| Web browsing | 51 minutes |
| Other | 29 minutes |
| Video calling | 20 minutes |
| E-reading | 15 minutes |
| Content creation | 14 minutes |
Source: Common Sense Media
Recommended Screen Time By Age
On average, the recommended screen time for teens is around 2 hours daily.
At the same time, toddlers are advised to spend 1 hour or less on their screens.
Note that this time does not include the time spent by teens on studying and doing schoolwork.
Besides, to balance out the time spent on screen, teens are advised to spend 2 hours on physical activities and 8 to 10 hours sleeping.
Source: NCBI
Adults are also recommended to limit their screen time to two hours per day outside of their work.
Hence, time beyond that adults are advised to spend on physical activity and engage in other activities with family.
Source: Reid Health
Average Screen Time By Country
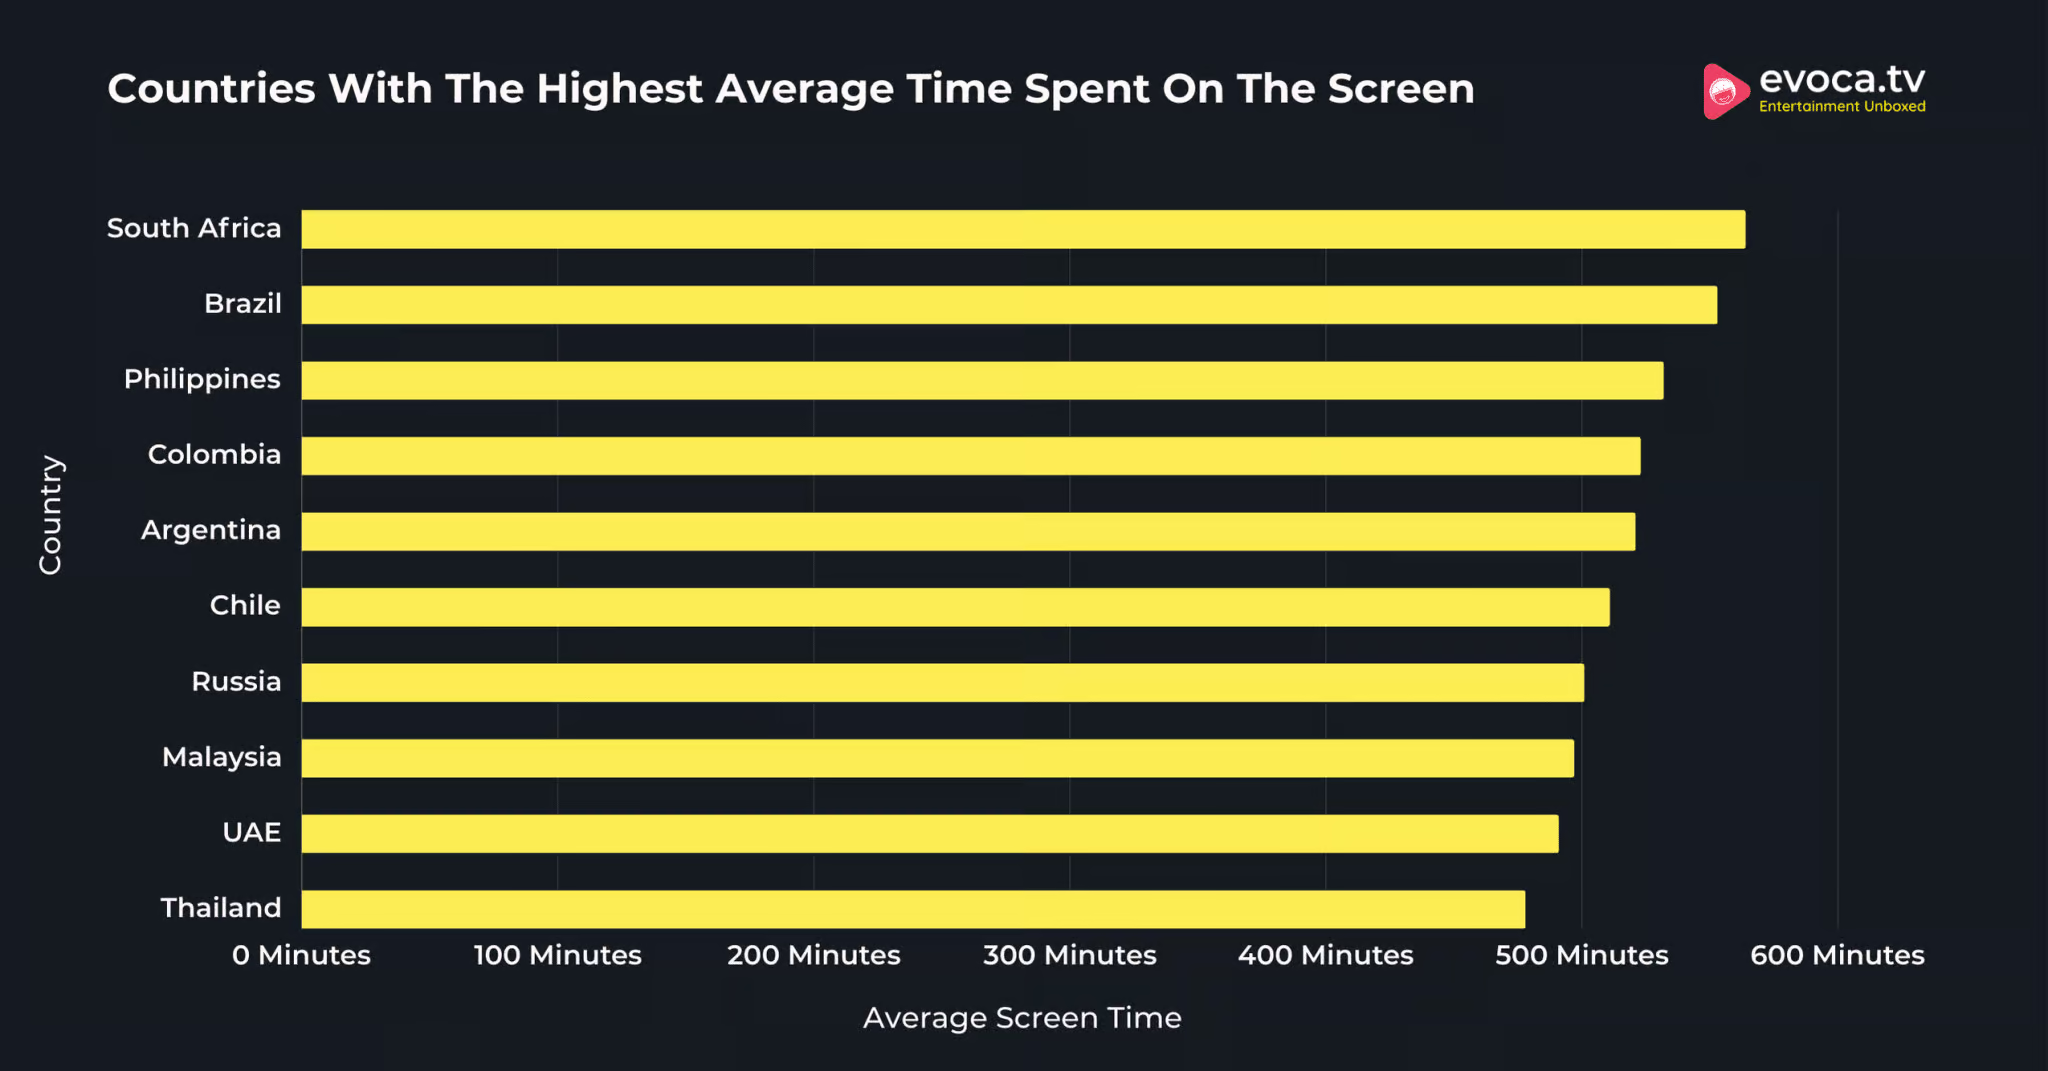
Adults in South Africa spend the most time on screen, using the Internet for 9 hours and 24 minutes every day.
That is 2 hours and 44 minutes higher than the global average.
At the same time, the second-highest average screen time is recorded in Brazil at 9 hours and 13 minutes, which is 2 hours and 33 minutes higher than the global average.
Other countries with the highest average time spent on screens are the Philippines, Colombia, and Argentina.

Here is a table displaying the countries with the highest average time spent on the screens using the Internet.
| Country | Average Screen Time | Difference with Global Average |
|---|---|---|
| South Africa | 9 hours 24 minutes | +2 hours 44 minutes |
| Brazil | 9 hours 13 minutes | +2 hours 33 minutes |
| Philippines | 8 hours 52 minutes | +2 hours 12 minutes |
| Colombia | 8 hours 43 minutes | +2 hours 3 minutes |
| Argentina | 8 hours 41 minutes | +2 hours 1 minute |
| Chile | 8 hours 31 minutes | +1 hour 51 minutes |
| Russia | 8 hours 21 minutes | +1 hour 41 minutes |
| Malaysia | 8 hours 17 minutes | +1 hour 37 minutes |
| UAE | 8 hours 11 minutes | +1 hour 31 minutes |
| Thailand | 7 hours 58 minutes | +1 hour 18 minutes |
| Egypt | 7 hours 55 minutes | +1 hour 15 minutes |
| Indonesia | 7 hours 38 minutes | +58 minutes |
| Mexico | 7 hours 37 minutes | +57 minutes |
| Portugal | 7 hours 30 minutes | +50 minutes |
| Bulgaria | 7 hours 29 minutes | +49 minutes |
Source: Data Reportal.
Japan has the lowest average screen time worldwide compared to other countries at 3 hours and 56 minutes.
It is 2 hours and 44 minutes lower than the global average.
The second-lowest average screen time was recorded in Denmark at 5 hours and 8 minutes. That’s 1 hour and 32 minutes less than the global average screen time.
Besides, there is a huge gap between the average screen time in Japan and Denmark, displaying the lowest addiction to screens in Japan.
South Korea, Germany, and France are other countries with lower average screen time.
The table below shows further details about the countries with the lowest average screen time worldwide.
| Country | Average Screen Time | Difference With Global Average |
|---|---|---|
| Japan | 3 hours 56 minutes | -2 hours 44 minutes |
| Denmark | 5 hours 8 minutes | -1 hour 32 minutes |
| South Korea | 5 hours 19 minutes | -1 hour 21 minutes |
| Germany | 5 hours 22 minutes | -1 hour 18 minutes |
| France | 5 hours 22 minutes | -1 hour 18 minutes |
| Belgium | 5 hours 22 minutes | -1 hour 18 minutes |
| Netherlands | 5 hours 30 minutes | -1 hour 10 minutes |
| Austria | 5 hours 31 minutes | -1 hour 9 minutes |
| Switzerland | 5 hours 32 minutes | -1 hour 8 minutes |
| China | 5 hours 33 minutes | -1 hour 7 minutes |
| Spain | 5 hours 42 minutes | -58 minutes |
| Norway | 5 hours 46 minutes | -54 minutes |
| Greece | 5 hours 48 minutes | -52 minutes |
| Italy | 5 hours 49 minutes | -51 minutes |
| UK | 6 hours 2 minutes | -38 minutes |
Source: Data Reportal.
Average Screen Time Spent On Social Media Apps
On average, people spend 2 hours and 23 minutes daily on screen using social media platforms.
That equals 35.8% of online screen time and a decrease of just 1 minute compared to 2 hours and 24 minutes spent on social media platforms in the last quarter of 2022.
The highest daily average social media screen time was recorded in Kenya, which was 3 hours and 43 minutes, while Japan had the lowest average daily social media screen time, which was just 53 minutes.
The following table displays the daily average screen time spent on social media.
| Quarter | Screen Time Spent On Social Media |
|---|---|
| Q3 2023 | 2 hours and 23 minutes |
| Q2 2023 | 2 hours and 24 minutes |
| Q1 2023 | 2 hours and 26 minutes |
| Q4 2022 | 2 hours and 24 minutes |
| Q3 2022 | 2 hours and 31 minutes |
| Q2 2022 | 2 hours and 28 minutes |
| Q1 2022 | 2 hours and 29 minutes |
| Q4 2021 | 2 hours and 29 minutes |
| Q3 2021 | 2 hours and 27 minutes |
Source: Data Reportal.
Average Screen Time Spent On Streaming Services
On average, users spend 3 hours and 9 minutes daily on streaming content.
Users spend a significant share of screen time on streaming content, and 95% of the viewers have logged in for at least two streaming services.
The daily time spent on streaming services translates to 21 hours per week people worldwide spend on streaming content.
Average Phone Screen Time
On average, people spend 4 hours and 37 minutes on their phone screens daily in the United States.
That equals more than one day a week and more than six days a month spent on mobile phones. Ultimately, it equals 70 days spent watching mobile screen every year.
On average, children in the United States get their first phone around the age of 12. Hence, if we consider the average life expectancy to be 76 years, then on average, people in the United States are likely to spend 12 years of their lives on mobile phone screens.
Source: OKWNews.
Conclusion: The Average Daily Screen Time Worldwide is 6 Hours And 40 Minutes!
Amongst the entire population of the world, women spend more time on their screens than men. Meanwhile, people over 55 years of age spend the least time on their screens.
Further, countries like South Africa and Brazil have the highest screen time of over 9 hours, while Japan has the lowest screen time of less than 4 hours.
In addition, teens spend an average of 6 hours and 40 minutes daily on screens, most of which is spent on TV and video games.
That’s all about the current scenario of the average time people worldwide spend on screens. Visit back later to get the latest updates and changes in these statistics.
To read more, here are some stats that may interest you:
