As the digital world progressed in the past decade, consumers’ content consumption habits experienced a significant shift. With the forthcoming of video streaming platforms, the use of connected TV is on the rise, and traditional TV will slowly become obsolete in 2024.
More than 200 million Americans currently use connected TVs, and 88% of U.S. households have a connected TV device in 2024.
This article features the most impactful statistics revolving around connected TV users, the market, and marketing and advertising.
Connected TV Statistics Top Highlights 2024
- The United States will have over 200.1 million connected TV users in 2024.
- 62.1 million U.S. Millennials use connected TVs in 2024.
- 88% of U.S. households owned at least one connected TV device in 2023.
- Connected TV ad spending in the United States is expected to reach $30.1 billion in 2024.
- The Connected TV market size will be valued at an estimated $9.28 billion in 2024.
- YouTube has an estimated 11.7% share of U.S. connected TV ad spending in 2024.
Connected TV Usage Statistics
Connected TV usage has surged in the past few years and is now used more than traditional TV.
In this section, let us find some statistics about the usage of connected TV.
There Will Be Over 200.1 Million Connected TV Users In The U.S. In 2024
The number of connected TV users is expected to reach 200.8 million by 2025.
197.8 million U.S. users were using connected TV in 2022, up from 191.6 million in 2021.
Further, around 184.8 million connected TV users were there in the United States in 2020.
Source: Statista
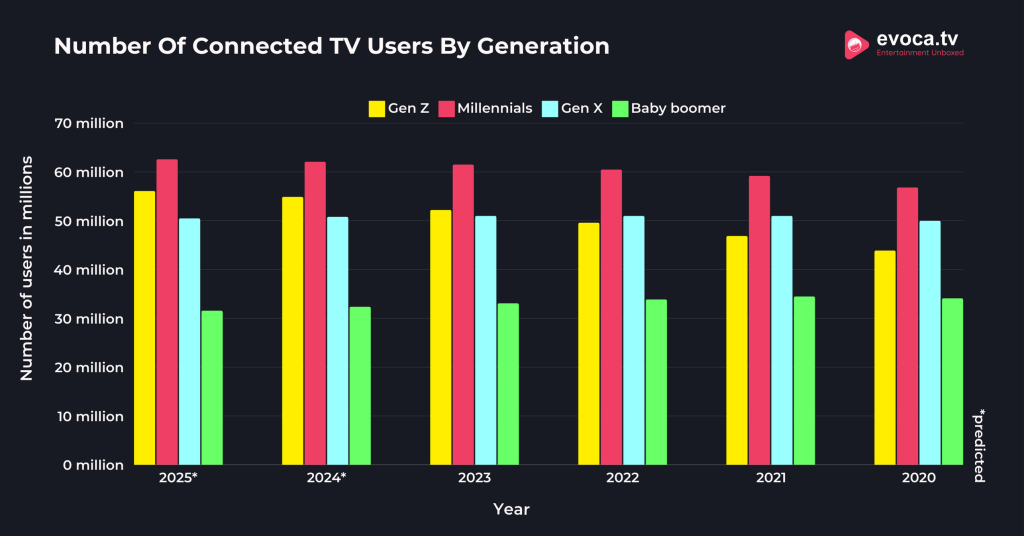
Approximately 62.1 Million U.S. Millennials Use Connected TV In 2024
62.6 million Millennials are estimated to use connected TV by 2025, making it the largest age group using connected TV in the U.S.
In 2024, around 54.9 million Gen Z and 50.8 million Gen X will use connected TV in the United States.
On the other hand, 52.2 million Gen Z and 51 million Gen X used connected TV in 2023.
Nearly 32.4 million baby boomers will use connected TV in 2024.
The table below shows the number of connected TV users in the U.S. over the years by generation:

| Year | Gen Z | Millennials | Gen X | Baby boomer |
| 2025* | 56.1 million | 62.6 million | 50.5 million | 31.6 million |
| 2024* | 54.9 million | 62.1 million | 50.8 million | 32.4 million |
| 2023 | 52.2 million | 61.5 million | 51 million | 33.1 million |
| 2022 | 49.6 million | 60.5 million | 51 million | 33.9 million |
| 2021 | 46.9 million | 59.2 million | 51 million | 34.5 million |
| 2020 | 43.9 million | 56.8 million | 50 million | 34.1 million |
Source: Statista *Projected numbers
88% Of U.S. Households Owned At Least One Connected TV Device In 2023
This represents the highest penetration rate of connected TV in the United States to date.
The penetration rate of connected TV in the U.S. was 82% in 2021, but it increased to 87% in 2022.
In comparison, the connected TV penetration rate in the U.S. was only around 50% in 2014.
During the pandemic, the penetration rate was around 80% in 2020 and 74% in 2019.
Here is a table showing the penetration rate of connected TVs over the years in the U.S.:
| Year | Connected TV Penetration Rate |
| 2023 | 88% |
| 2022 | 87% |
| 2021 | 82% |
| 2020 | 80% |
| 2019 | 74% |
| 2018 | 74% |
| 2017 | 69% |
| 2016 | 65% |
| 2015 | 57% |
| 2014 | 50% |
Source: Statista
Connected TV Market Statistics
With the increase in online video content and OTT platforms, the connected TV market is flourishing in 2024.
In this section, let us explore the financial statistics about the connected TV market.
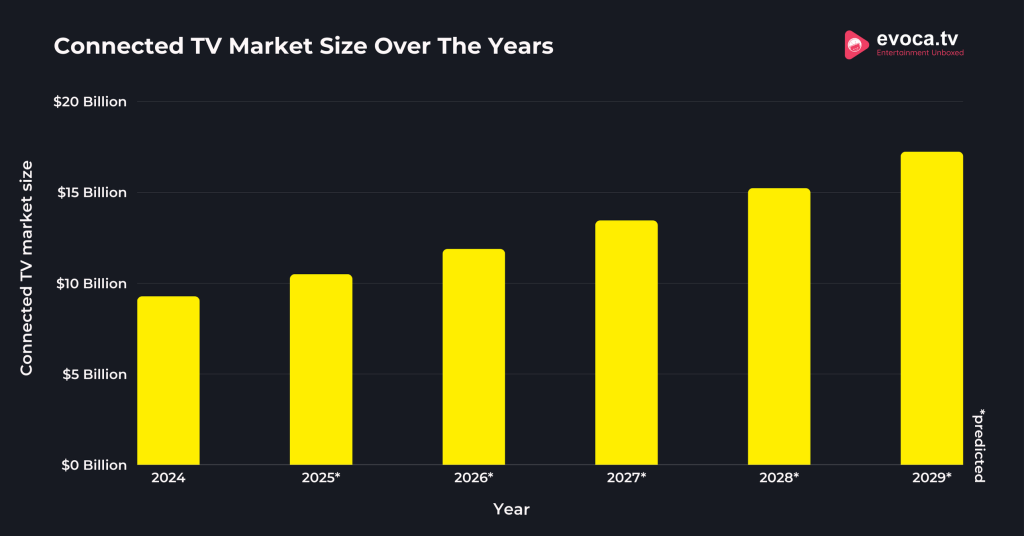
The Connected TV Market Size Will Be Valued At An Estimated $9.28 Billion In 2024
The connected TV market is projected to grow at a CAGR of 13.20% between 2024 and 2029.
Growing by over 85.87%, the market is expected to reach $17.25 billion by 2029.
Samsung Corporation, LG Electronics, and Sony Corporation are the key major players in the connected TV market.
Here is a table with connected TV market size over the years:

| Year | Connected TV Market Size |
| 2024 | $9.28 billion |
| 2025* | $10.50 billion |
| 2026* | $11.89 billion |
| 2027* | $13.46 billion |
| 2028* | $15.24 billion |
| 2029* | $17.25 billion |
Source: Mordor Intelligence *Projected numbers calculated considering 13.20% CAGR
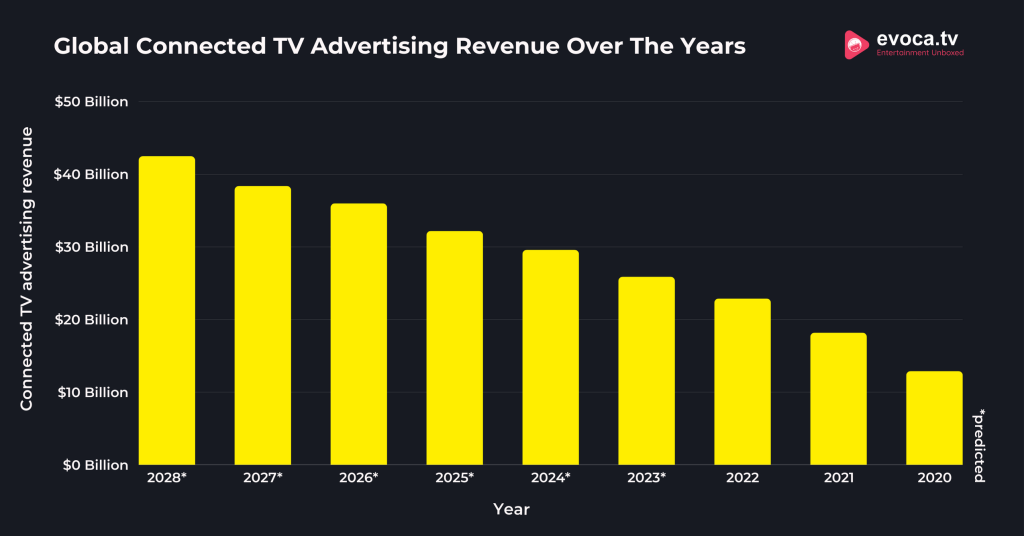
The Global Connected TV Advertising Revenue Is Expected To Reach $29.6 Billion In 2024
Advertising revenue was around $25.9 billion in 2023, an increase of over $10 billion from $12.9 billion in 2020.
Forecasts suggest the global connected TV advertising revenue will reach $42.5 billion by 2028.
The connected TV advertising revenue was nearly $18.2 billion in 2021 and $22.9 billion in 2022.
The table below shows the global connected TV advertising revenue over the years:

| Year | Connected TV Advertising Revenue |
| 2028* | $42.5 billion |
| 2027* | $38.4 billion |
| 2026* | $36 billion |
| 2025* | $32.2 billion |
| 2024* | $29.6 billion |
| 2023* | $25.9 billion |
| 2022 | $22.9 billion |
| 2021 | $18.2 billion |
| 2020 | $12.9 billion |
Source: Statista *Projected numbers
Connected TV Consumer Statistics
The ease of accessing video content has transformed consumers’ digital content consumption habits.
Everyone from children to veterans has a dedicated watchlist they follow at their own pace and comfort.
Let us look at a few statistics regarding connected TV consumers.
34% Of Connected TV Consumers Preferred Free Ad-Supported Streaming Content In 2022
Conversely, around 33% of consumers preferred ad-free paid content.
About 32% of connected TV consumers preferred tiered content that offered both paid and ad-supported content.
Source: Statista
64% Of Connected TV Viewers In The U.S. Prefer To Watch Ads If They Are Paying Less
Meanwhile, 65% of connected TV consumers believed targeted ads improve their viewing experience.
In addition, 57% of consumers reported that CTV ads are more relevant than linear TV ads.
Source: Statista
33% Of Connected TV Users In The U.S. Preferred Not To See Ads And Pay More For The Service
In contrast, 67% of connected TV users preferred to see ads and pay less for the service.
Among linear TV users, 75% preferred to see ads and pay less for the service, and 25% preferred not to see ads and pay more for the service.
59% of consumers using both linear TV and connected TV preferred to see ads and pay less for the service.
Source: Statista
Connected TV Advertising Statistics
The advertising industry has the most significant effect on connected TV users. Advertisers have adopted new ad strategies to capitalize on the large number of connected TV viewers.
This section will cover the most influential statistics about advertising on connected TV.
Connected TV Ad Spending In The United States Is Expected To Reach $30.1 Billion In 2024
Advertisers in the U.S. spent around $24.6 billion on connected TV ads in 2023.
The connected TV ad spend has increased gradually over the years and is projected to reach $42.4 billion by 2027.
The ad spending jumped from $9 billion in 2020 to $17.3 billion in 2021.
The table below shows the connected TV ad spending in the U.S. over the years:
| Year | Connected TV ad spending |
| 2027* | $42.4 billion |
| 2026* | $38.2 billion |
| 2025* | $34.3 billion |
| 2024* | $30.1 billion |
| 2023 | $24.6 billion |
| 2022 | $20.7 billion |
| 2021 | $17.3 billion |
| 2020 | $9 billion |
| 2019 | $6.4 billion |
Source: Statista *Projected numbers
Connected TV Ad Spending In The United States is Estimated To Grow By 16.8% In 2024
The CTV ad spending in 2023 grew by 21.2% and 19.6% in 2022.
It is estimated that connected TV ad spending will increase by 11% in 2027.
In 2021, the ad spending in the U.S. experienced an impressive increase of 58.2%.
The table below shows the ad spend growth in the U.S. over the years:
| Year | Growth In Ad Spending |
| 2027* | 11% |
| 2026* | 11.5% |
| 2025* | 12.9% |
| 2024* | 16.8% |
| 2023 | 21.2% |
| 2022 | 19.6% |
| 2021 | 58.2% |
Source: Statista *Projected numbers
16.5% Of Programmatic Digital Display Ad Spending In The U.S. Was Invested In Connected TV Devices In 2023
While 70.6% of digital display ad spending was invested in mobile ads and 12.9% in desktop ads.
In 2021, connected TV devices accounted for 9.7% of digital display ad spending, while mobile devices accounted for 75.9%.
Digital display ad spending on connected TV devices was around 7.5% in 2020 and 5.6% in 2019.
The table below shows the distribution of digital display advertising spending in the United States by device:
| Year | Connected TV | Mobile | Desktop Or Laptop |
| 2023 | 16.5% | 70.6% | 12.9% |
| 2021 | 9.7% | 75.9% | 14.4% |
| 2020 | 7.5% | 75.9% | 16.5% |
| 2019 | 5.6% | 74.4% | 20% |
| 2013 | – | 39.3% | 60.7% |
Source: Statista
Connected TV Retail Media Ad Spend In The U.S. Will Cross $1.49 Billion In 2024
Retail media ad spending for connected TV is expected to increase by over $2.45 billion by 2025.
In 2023, $812.6 million was spent on connected TV retail media ads, an increase of nearly $360 million from the $452.7 million spent in 2022.
Moreover, $217.4 million was spent on connected TV retail media ads in 2021.
Source: Statista
YouTube Has An 11.7% Share Of U.S. Connected TV Ad Spend In 2024
With a 13.4% share of total ad spending in the U.S., Hulu leads the CTV ad spending in 2024.
Roku has a 10.1% share of connected TV ad spending in the U.S., and Netflix has a 2.6% share.
Disney+ has a 3.1% share of CTV ad spending, while Paramount+ has just 1.7% share.
The table below shows the distribution of connected TV advertising spending in the United States by top platforms:
| Year | Hulu | YouTube | Roku | Pluto TV | Tubi |
| 2024* | 13.4% | 11.7% | 10.1% | 4.4% | 2.8% |
| 2023* | 13.8% | 11.7% | 9.5% | 4.1% | 2.7% |
| 2022 | 15.5% | 13.3% | 10.1% | 4.1% | 2.9% |
| 2021 | 17.6% | 14.1% | 9.5% | 4.2% | 2.7% |
| 2020 | 19.8% | 14.3% | 7.6% | 3.5% | 1.9% |
Source: Statista *Projected numbers
Hulu Generated Over $3.63 Billion In Ad Revenue In 2023
YouTube amassed an estimated $2.89 billion ad revenue, and Roku generated around $2.19 billion.
Netflix’s ad revenue was $620 million in 2023, while Disney+’s was $750 million.
The table below shows the Connected TV advertising spending in the United States in 2023:
| Platform | Ad Revenue |
| Hulu | $3.63 billion |
| YouTube | $2.89 billion |
| Roku | $2.19 billion |
| Pluto TV | $950 million |
| Peacock | $810 million |
| Tubi | $770 million |
| Disney+ | $750 million |
| Netflix | $620 million |
| Paramount+ | $280 million |
| Other subscription OTT-connected TV platform | $1.45 billion |
| Other | $10.74 billion |
Source: Statista
Connected TV Marketer Statistic
Content consumption through connected TV is increasing, and marketers are trying out new strategies to capture the target audience through ads.
This section will cover the statistics about marketers and connected TV.
37% Of U.S. Marketers Reported Increasing Their Ad Spend By Reallocating Budgets From Digital TV In 2023
36% of marketers reallocated their ad spend budget from other types of digital or mobile video to CTV ads.
31% of advertisers said they were reallocating media budgets from social media platforms and 32% from audience-based linear.
Approximately 30% of advertisers moved ad spending budgets from non-video digital ads, while 31% boosted their total advertising budget.
Source: Statista
36% Of Marketers Reported Macroeconomic Headwinds As An Obstacle To Increasing Connected TV Ad Spending
At the same time, 31% of marketers cited expensive campaigns and high CPMs as challenges in increasing connected TV ads.
Lack of budget was a challenge for 26% of marketers, and lack of scale was a challenge for 21% of marketers.
The inability to prove ROI or ROAs was a challenge faced by 26% of marketers while increasing connected TV ad spending.
Source: Statista
24% Of Marketers Reported Being Very Concerned About Connected TV Ad Fraud
At the same time, 61% of U.S. marketers were somewhat concerned over ad fraud in connected TV and OTT advertising.
On the other hand, 15% of marketers were not too concerned about connected TV ad fraud, while 1% of marketers were not at all concerned.
Source: Statista
47% Of Marketers Reported Audience Targeting Capabilities As A Reason For Increasing Their Connected TV Ad Spend In 2023
On the contrary, the inability to reach audiences that no longer use linear TV was a reason for 41% of marketers to increase their CTV ad spending.
28% of marketers revealed that the personalization capabilities motivated them to increase their connected TV ad spending.
The ability to prove ROI and ROAs was a significant reason for 35% of marketers to increase their CTV ad spend.
The table below shows the reasons for increasing connected TV ad spend by marketers in the U.S.:
| Reason | Percentage Of Marketers |
| Audience targeting capabilities | 47% |
| Ability to reach audiences no longer on linear TV | 41% |
| Delivers reach or scale overall | 38% |
| Delivers incremental reach | 35% |
| Ability to prove ROI/ROAs | 35% |
| Measurement capabilities | 32% |
| Offers creative formats not available on linear TV | 28% |
| Personalization capabilities | 28% |
Source: Statista
Related Read:
Conclusion: Over 200 Million Americans to Embrace Connected TV by 2024
With millions of people using Connected TV, it has virtually become a norm in 2024.
The digital revolution has proved immensely beneficial for consumers and marketers. The numerous benefits connected TV devices offer have helped it surpass the number of traditional TV viewers.
Over 62.1 million Americans will use connected TV in 2024 and the market size is expected to reach $9.28 billion.
The connected TV trend is only increasing and will continue to attract more consumers to adopt the broadcast innovations.
These were the most noteworthy statistics about connected TV users, usage, advertising, and marketing.