Surpassing 301.6 million subscribers as of 2025, Netflix remains a giant in the streaming industry that’s constantly growing. In Q4 2024, it gained a record 18.9 million new users, bringing the year’s total to 41 million.
Revenue hit $39 billion in 2024, projected at $44 billion for 2025. The platform is investing $18 billion in new content and saw massive success with its first-ever NFL Christmas games, drawing 30 million viewers each.
With steady growth, rising profits, and a growing content library, Netflix continues to shape the future of entertainment. This article explores the latest Netflix stats, including subscribers, revenue, and usage trends.
Netflix Statistics 2025 (Latest Research Data)
- As of 2025, Netflix has over 301.6 million subscribers worldwide.
- More than 81.44 million Netflix users are from the United States.
- In 2024, Netflix generated $39 billion in revenue and expects to earn $10.42 billion in Q1 2025.
- It is the second most popular SVOD platform in the U.S., holding a 21% market share.
- More than one-third of Netflix users are Millennials.
- In Q4 2024, Netflix reported a net income of $1.87 billion.
How Many Subscribers Does Netflix Have?
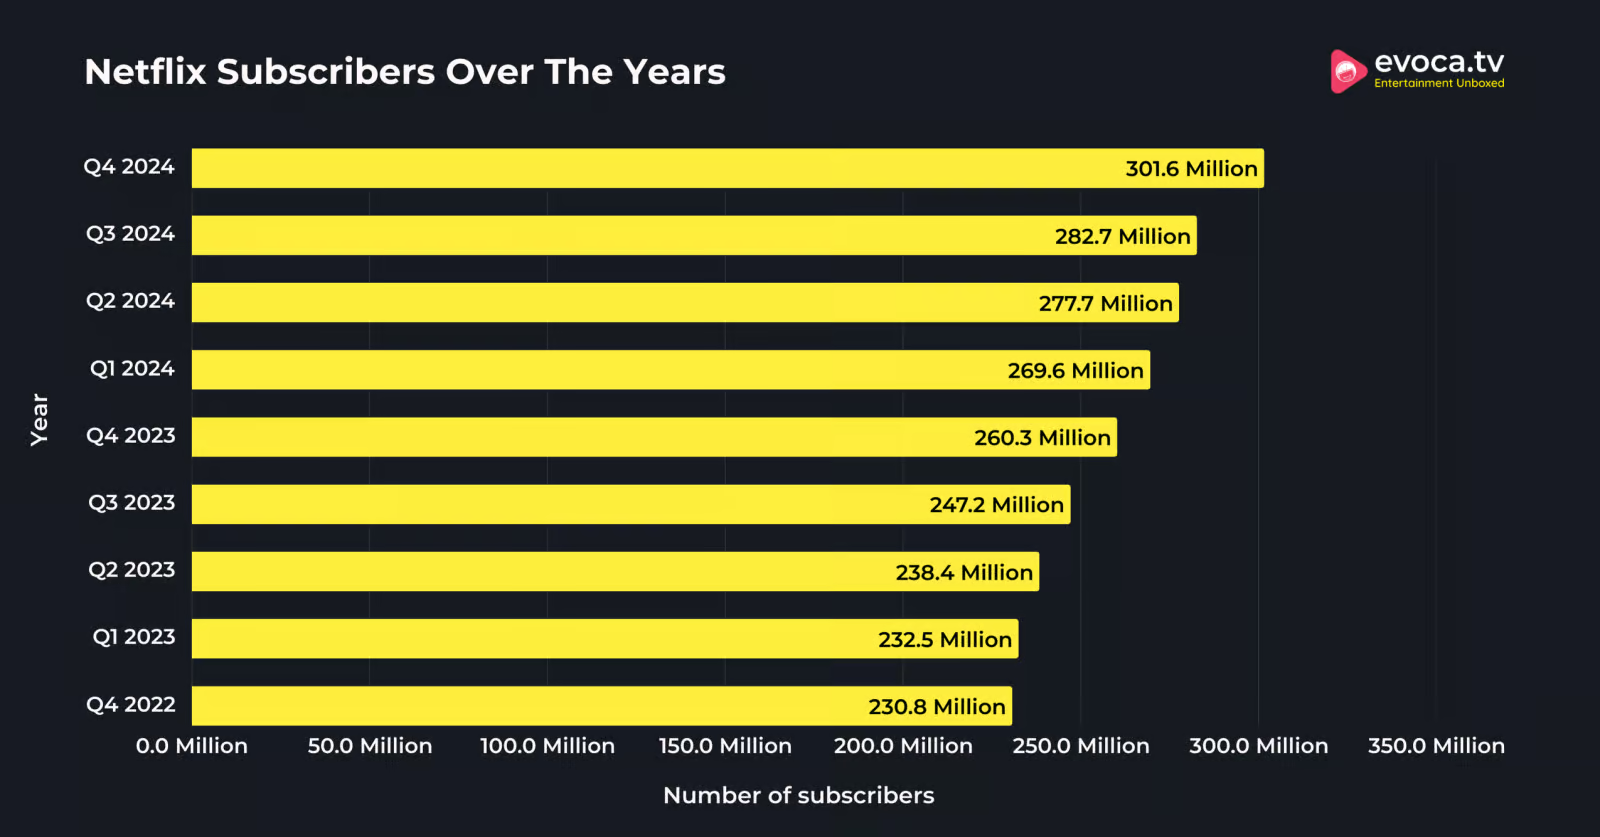
Netflix now has 301.6 million subscribers worldwide.
That’s a 15.9% increase compared to 260.28 million Netflix subscribers recorded at the end of 2023.
In just the last quarter of 2024, the platform gained around 19 million new subscribers, a 6.69% rise. Looking at the bigger picture, Netflix added nearly 41 million subscribers in the last year.

Here is a table showing the number of Netflix subscribers by quarter:
| Year | Number Of Subscribers |
|---|---|
| Q4 2024 | 301.6 million |
| Q3 2024 | 282.7 million |
| Q2 2024 | 277.65 million |
| Q1 2024 | 269.6 million |
| Q4 2023 | 260.28 million |
| Q3 2023 | 247.15 million |
| Q2 2023 | 238.39 million |
| Q1 2023 | 232.5 million |
| Q4 2022 | 230.75 million |
| Q3 2022 | 223.09 million |
| Q2 2022 | 220.67 million |
| Q1 2022 | 221.64 million |
| Q4 2021 | 221.84 million |
| Q3 2021 | 213.56 million |
| Q2 2021 | 209.18 million |
| Q1 2021 | 207.64 million |
Source: Statista
The United States And Canada Region Has 89.63 Million Netflix Subscribers.
This region makes up the second-largest Netflix market worldwide.
With over 101.13 million subscribers, the Europe, the Middle East, and Africa (EMEA) region is the biggest Netflix market globally.
Latin America has 53.33 million Netflix subscribers, while Asia Pacific has over 57.54 million subscribers.
Here is a table displaying the Netflix subscribers by Region as of Q3 2024.
| Region | Netflix Subscribers |
|---|---|
| Europe, Middle East, and Africa | 101.13 million |
| U.S. and Canada | 89.63 million |
| Asia Pacific | 57.54 million |
| Latin America | 53.33 million |
Source: Statista
Netflix Users By Country
With 81.44 million subscribers, the U.S. remains Netflix’s largest market.
Coming in second, the U.K. leads Europe with 18.4 million subscribers.
Meanwhile, Germany and Brazil are tied at 16.59 million subscribers each, highlighting Netflix’s strong presence in both Western Europe and Latin America.
On the growth front, India, Brazil, and South Korea are emerging as key markets, driven by Netflix’s focus on localized content and affordable pricing strategies.
Here is a table showing the number of Netflix subscribers by country:
| Country | Number Of Netflix Subscribers |
|---|---|
| United States | 81,440,100 |
| United Kingdom | 18,399,430 |
| Germany | 16,589,650 |
| Brazil | 16,589,650 |
| Mexico | 13,874,980 |
| France | 13,573,350 |
| India | 12,366,830 |
| Canada | 9,048,900 |
| Japan | 9,048,900 |
| South Korea | 8,355,151 |
Source: Flix Patrol
Netflix Usage Statistics
Americans Are Estimated To Spend 62.1 Minutes On Netflix.
Comparatively, U.S. citizens spent an average of 61.8 minutes watching Netflix in 2023.
On the other hand, users are estimated to spend 48.7 minutes on YouTube and 58.4 minutes on TikTok.
The United States Netflix users spent 61.3 minutes on Netflix in 2022.
The table below shows the average time spent by Americans on Netflix.
| Year | Netflix |
|---|---|
| 2024 | 62.1 minutes |
| 2023 | 61.8 minutes |
| 2022 | 61.3 minutes |
| 2021 | 60.5 minutes |
| 2020 | 59.6 minutes |
| 2019 | 53.3 minutes |
Source: Statista
10% of White Americans Reported Watching Netflix Once Daily In 2022
Moreover, 13% of Blacks and 12% of Hispanics watched Netflix once every day in 2022.
Around 21% of Whites and 18% of Blacks reported watching Netflix a few times per week.
Conversely, 37% of Whites and 20% of Hispanics reported never watching Netflix in 2022.
Source: Statista
25% of U.S. Millennials Reported Watching Netflix Multiple Times A Day in 2023
Meanwhile, 19% of U.S. Gen Z and 17% of Gen X used Netflix multiple times a day.
Gen Z users are the most avid users of Netflix, and 30% of them reported watching it a few times per week in 2023.
Around 49% of Baby Boomers reported never using Netflix, while 20% watched a few times per week.
The table below shows the frequency of Netflix viewing in the U.S. In 2023:
| Generation | Multiple Times A Day | A Few Times Per Week | Never |
|---|---|---|---|
| Gen Z | 19% | 30% | 12% |
| Millennials | 25% | 23% | 15% |
| Gen X | 17% | 21% | 31% |
| Baby Boomers | 7% | 20% | 49% |
Source: Statista
Netflix User Demographic Statistics
Netflix boasts a diverse and loyal customer base and is popular among users of every age and gender.
Let’s look at the age and gender demographics of Netflix users below.
51% of Netflix Users Are Female, while 49% Are Male
The gender split of Netflix users is almost evenly distributed, and females are the dominant gender in Netflix usage.
Source: Tridens Technology
33.3% of Netflix Users Are Millennials
On the other hand, Gen Z makes up 18.2% of Netflix’s user base.
26.3% of Netflix users come from Generation X, and 22.2% are Baby Boomers.
Source: Tridens Technology
72% of Internet Users Aged Between 18 and 29 Years Reported Using Netflix
A 2023 survey revealed that 70% of U.S. internet users aged 30 to 49 reported using Netflix between March 2022 and March 2023.
Meanwhile, 69% of U.S. internet users from the 50- 64 age group used Netflix in 2023.
Source: Statista
Netflix Revenue
Netflix expects to generate $10.42 billion in revenue for Q1 2025, reflecting an 11.2% year-over-year growth.
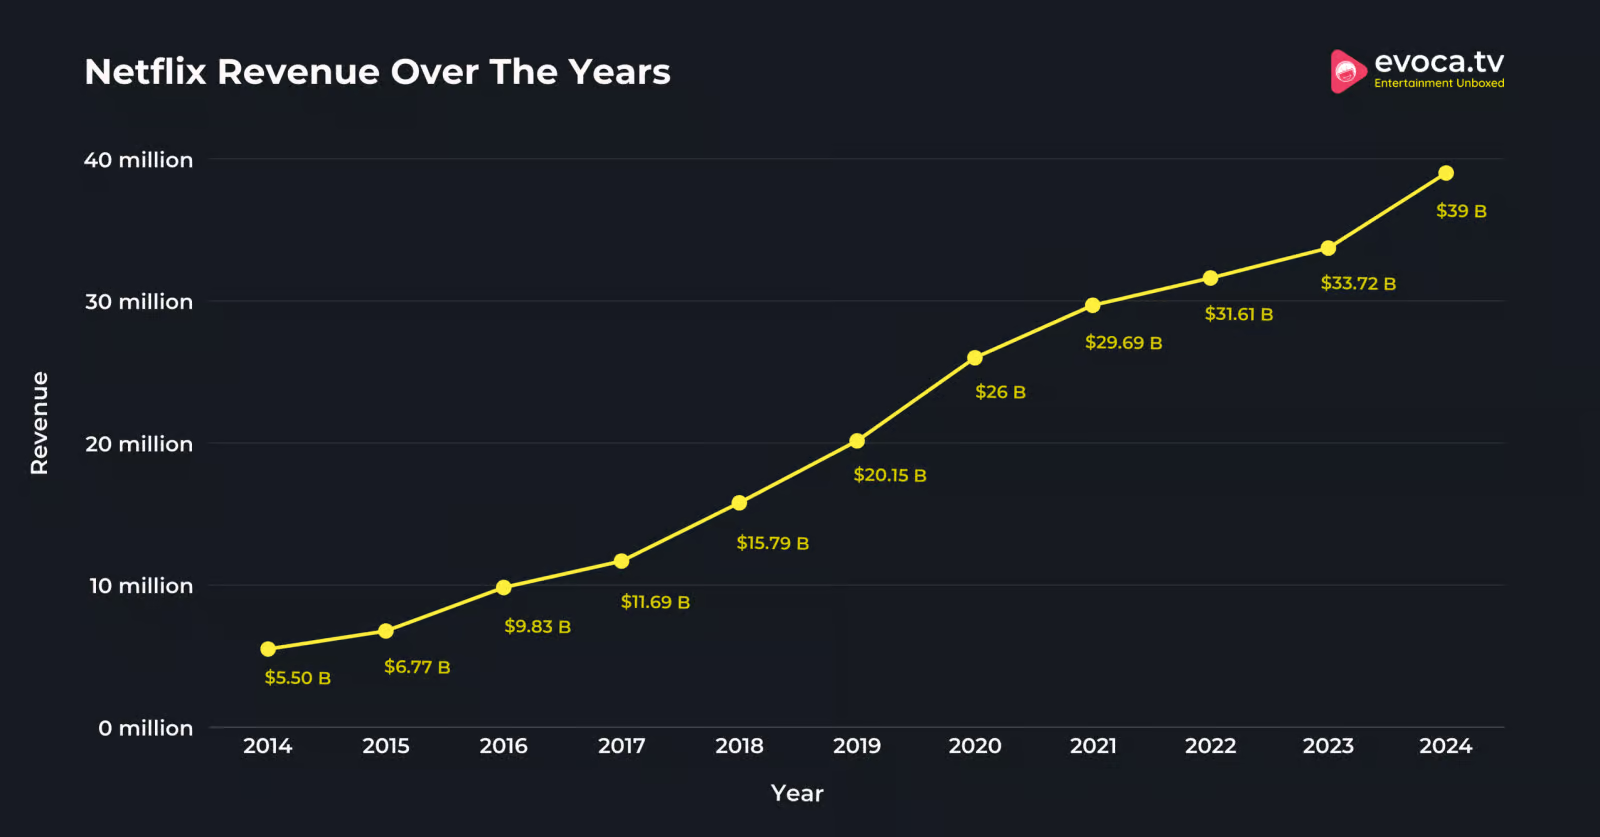
In 2024, the company brought in a total of $39 billion, with revenue steadily increasing throughout the year. The final quarter contributed the most at $10.25 billion, followed by $9.82 billion in Q3, $9.56 billion in Q2, and $9.37 billion in Q1.

The table below shows Netflix’s yearly revenue over the years:
| Year | Revenue |
|---|---|
| 2024 | $39 billion |
| 2023 | $33.72 billion |
| 2022 | $31.61 billion |
| 2021 | $29.69 billion |
| 2020 | $26 billion |
| 2019 | $20.15 billion |
| 2018 | $15.79 billion |
| 2017 | $11.69 billion |
| 2016 | $9.83 billion |
| 2015 | $6.77 billion |
| 2014 | $5.50 billion |
Source: Statista, Netflix.
Netflix Was Estimated To Generate $31 Billion In Subscription Revenue In 2024
Further, Netflix is anticipated to earn over $3.6 billion from ad revenue in 2024.
Subscription revenue is expected to reach $26.9 billion by 2027. Meanwhile, ad revenue is projected to reach $7.4 billion.
The table below shows the estimated subscription and ad revenue of Netflix between 2023 and 2027:
| Year | Subscription Revenue | Ad Revenue |
|---|---|---|
| 2027* | $26.9 billion | $7.4 billion |
| 2026* | $28.1 billion | $6.3 billion |
| 2025* | $29.6 billion | $5 billion |
| 2024* | $31 billion | $3.6 billion |
| 2023* | $32.3 billion | $1.4 billion |
Source: Statista *Projected numbers
Netflix Revenue By Region
Netflix generated $14.87 Billion In Revenue In The U.S. and Canada Region In 2023
The U.S. and Canada region significantly contributed to Netflix’s revenue in 2023.
At the same time, the European, Middle Eastern, and African regions generate over $10.55 billion in revenue.
Netflix generated $4.44 billion in revenue in Latin America and $3.76 billion in the Asia Pacific region.
Here is a table displaying the distribution of Netflix revenue by region:
| Region | Netflix Revenue |
|---|---|
| U.S. and Canada | $14.87 million |
| Europe, Middle East, and Africa | $10.56 million |
| Latin America | $4.45 million |
| Asia Pacific | $3.76 million |
Source: Statista
Netflix Net Income
Netflix achieved a record-breaking net income of $2.36 billion in Q3 2024, the highest among recent quarters.
In comparison, the company reported $1.87 billion in Q4, $2.15 billion in Q2, and $2.33 billion in Q1.
Looking back, Netflix’s total net income for 2023 was around $5.40 billion, up by nearly $910 million from 2022, highlighting its steady financial growth.
The table below shows the net income produced by Netflix over the years:
| Year | Net Income |
|---|---|
| Q4 2024 | $1.87 billion |
| Q3 2024 | $2.36 billion |
| Q2 2024 | $2.15 billion |
| Q1 2024 | $2.33 billion |
| 2023 | $5.40 billion |
| 2022 | $4.49 billion |
| 2021 | $5.11 billion |
| 2020 | $2.76 billion |
| 2019 | $1.86 billion |
| 2018 | $1.21 billion |
| 2017 | $558.93 million |
Netflix ARPU
In 2024, Netflix’s ARPU stands at $11.7
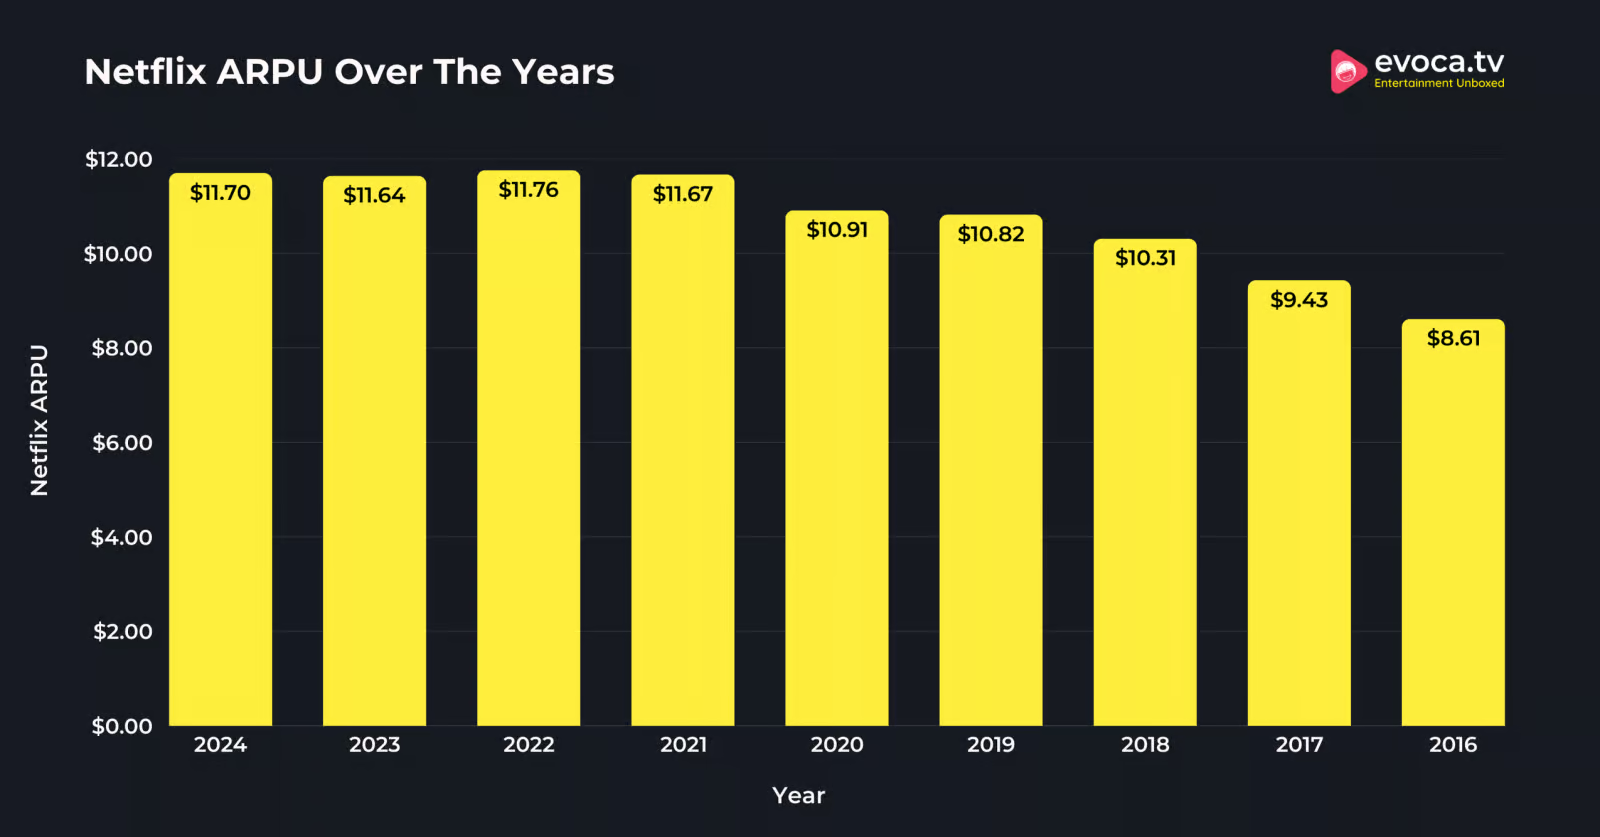
In 2024, Netflix’s ARPU reached $11.7.
The ARPU reached its highest point at $11.76 in 2022, dipped slightly in 2023, and rose again in 2024.
From 2021 to 2024, the ARPU stayed steady, ranging between $11.67 and $11.76, showing consistent revenue per user.
Between 2019 and 2020, the price increased noticeably from $10.82 to $10.91, likely due to the surge in streaming during the pandemic.
Overall, Netflix’s ARPU has grown by 13.5% over six years, moving from $10.31 in 2018 to $11.7 in 2024.

Here is a table showing Netflix’s monthly ARPU over the years:
| Year | Netflix ARPU |
|---|---|
| 2024 | $11.7 |
| 2023 | $11.64 |
| 2022 | $11.76 |
| 2021 | $11.67 |
| 2020 | $10.91 |
| 2019 | $10.82 |
| 2018 | $10.31 |
| 2017 | $9.43 |
| 2016 | $8.61 |
Source: Statista
Netflix ARPU By Region
In Q4 2024, Netflix saw the highest Average Revenue Per User (ARPU) in the U.S. and Canada, reaching $17.26.
Meanwhile, the Europe, Middle East, and Africa (EMEA) region had an ARPU of $11.11, showing a moderate revenue stream per user.
In Latin America, the ARPU stood at $8, while the Asia Pacific (APAC) region had the lowest at $7.34, emphasizing Netflix’s efforts to maintain affordability and expand its presence in these markets.
| Region | ARPU |
|---|---|
| U.S. and Canada | 17.26 |
| Europe, Middle East, and Africa | 11.11 |
| Latin America | 8 |
| Asia Pacific | 7.34 |
Source: Statista
Netflix Market Share
Netflix is the second most popular SVOD platform in the United States, with a 21% share of the market.
Meanwhile, Amazon Prime has surpassed Netflix and is now the leading SVOD platform in the country.
Here is a table showing the market share of Netflix in the SVOD market in the U.S.:
| SVOD Platform | Market Share |
|---|---|
| Amazon Prime Video | 22% |
| Netflix | 21% |
| Max | 13% |
| Disney+ | 12% |
| Hulu | 10% |
| Paramount+ | 9% |
| Apple TV+ | 8% |
| Peacock | 1% |
| Other | 3% |
Source: Statista
Netflix Downloads
Netflix Mobile App Was Downloaded Over 18.21 million.
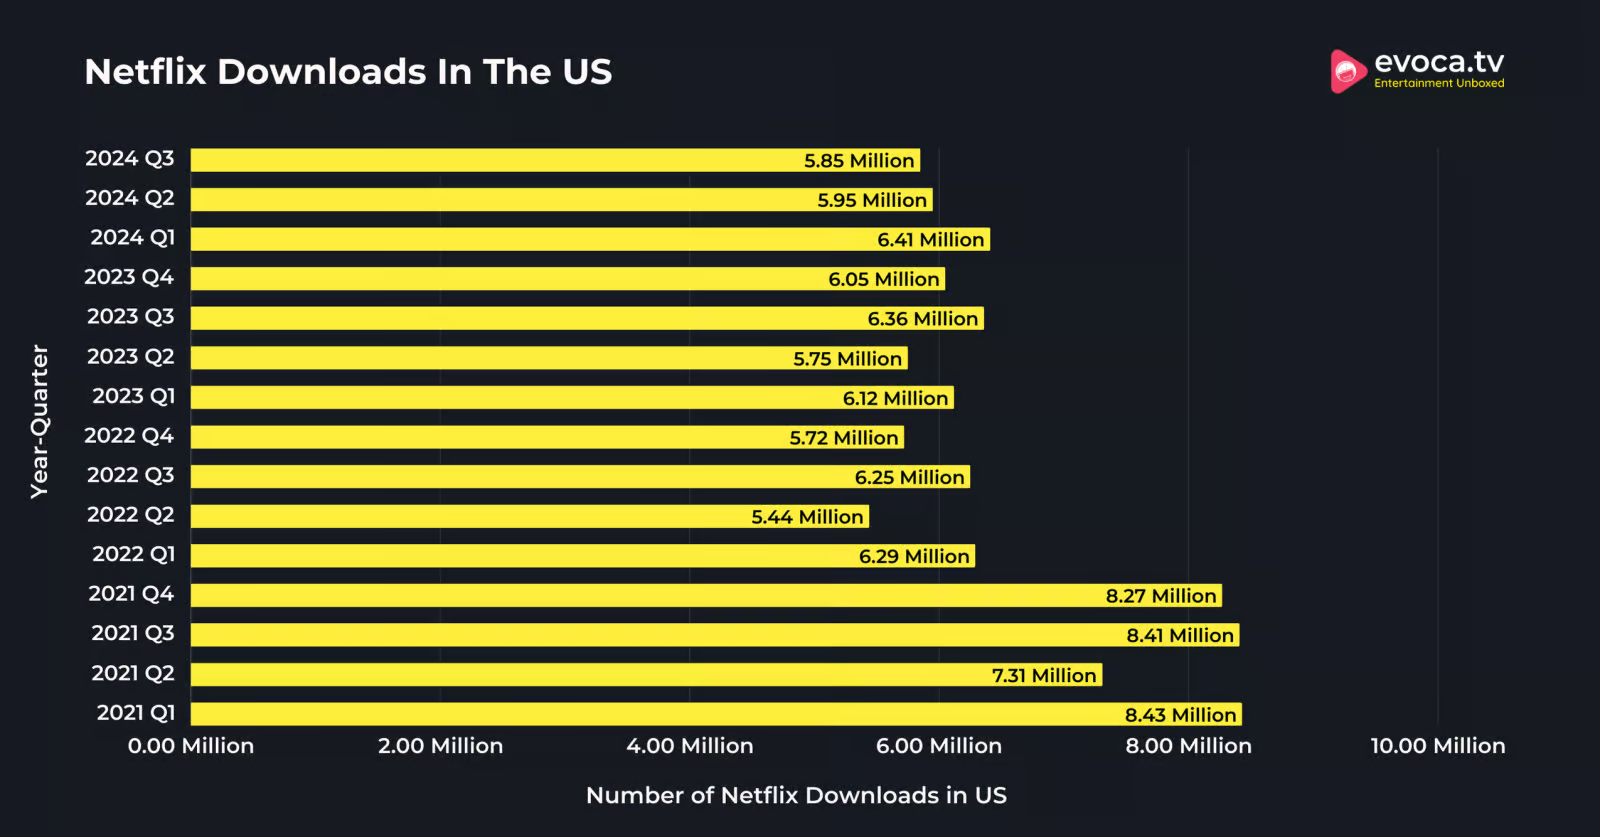
Netflix downloads for 2024 Q3 are down by 8% compared to the 2023 Netflix Q3 downloads.
In 2023, Netflix recorded a total download of 24.28 million, a 2.45% increase compared to 23.7 million downloads in 2022.

The following table displays the number of Netflix Mobile App downloads recorded over the past quarters in the United States.
| Year-Quarter | Number Of Netflix Downloads In US |
|---|---|
| 2024 Q3 | 5.85 million |
| 2024 Q2 | 5.95 million |
| 2024 Q1 | 6.41 million |
| 2023 Q4 | 6.05 million |
| 2023 Q3 | 6.36 million |
| 2023 Q2 | 5.75 million |
| 2023 Q1 | 6.12 million |
| 2022 Q4 | 5.72 million |
| 2022 Q3 | 6.25 million |
| 2022 Q2 | 5.44 million |
| 2022 Q1 | 6.29 million |
| 2021 Q4 | 8.27 million |
| 2021 Q3 | 8.41 million |
| 2021 Q2 | 7.31 million |
| 2021 Q1 | 8.43 million |
Source: Statista
Netflix Content Statistics
Netflix Content Spending Is Projected To Reach $17 Billion
Comparatively, Netflix spent $13 billion on content in 2023. Netflix’s content spending has declined in the past two years and is estimated to rise again. Most users look for a Netflix free trial to stream the content for free; however, it impacts the revenue.
In 2021, Netflix spent the highest amount of $17.5 billion on its content.
Here is a table displaying further details about Netflix’s spending on its content over the years.
| Year | Netflix’s Content Spending |
|---|---|
| 2024* | $17 billion |
| 2023 | $13 billion |
| 2022 | $16.7 billion |
| 2021 | $17.5 billion |
| 2020 | $12.5 billion |
| 2019 | $14.6 billion |
| 2018 | $12.04 billion |
| 2017 | $8.91 billion |
| 2016 | $6.88 billion |
| 2012 | $1.75 billion |
* Estimated Values
Source: Statista
With 8,427 Movies And TV Shows, Slovakia Had The Most Content Available On Netflix As Of March 2023
At the same time, countries like Bulgaria and Latvia had the second and the third highest number of movies and TV shows available on Netflix.
Besides, 5,800 content titles are available in the United States alone.
The following table displays the countries with the most content titles available on Netflix as of March 2023.
| Country | Number Of Movies And TV Shows |
|---|---|
| Slovakia | 8,427 |
| Bulgaria | 8,272 |
| Latvia | 8,092 |
| Estonia | 8,071 |
| Iceland | 8,012 |
| Lithuania | 7,994 |
| Romania | 7,748 |
| UK | 7,482 |
| Portugal | 7,411 |
Source: Statista
Netflix Employee Statistics
13,000 Employees Worked Full-Time At Netflix In 2023.
This was an increase of 200 full-time employees at Netflix compared to that recorded in the previous year.
In 2022, 12,800 employees worked at Netflix.
The following table provides further details about the number of employees working at Netflix:
| Year | Number Of Netflix Employees |
|---|---|
| 2023 | 13,000 |
| 2022 | 12,800 |
| 2021 | 11,300 |
| 2020 | 9,400 |
| 2019 | 8,600 |
| 2018 | 7,100 |
| 2017 | 5,400 |
| 2016 | 4,500 |
| 2015 | 3,500 |
Source: Statista
Most Popular Shows On Netflix
With 252.1 Million Views Just Within The First 91 Days, Wednesday: Season 1 Is The Most Popular Title On Netflix
With 140.7 million views on Netflix, Stranger Things 4 is the second most popular title on Netflix.
The following table displays the most popular titles on Netflix according to the views recorded within the first 91 days of its release.
| Rank | Title | Views |
|---|---|---|
| 1 | Wednesday: Season 1 | 252,100,000 |
| 2 | Stranger Things 4 | 140,700,000 |
| 3 | DAHMER: Monster: The Jeffrey Dahmer Story | 115,600,000 |
| 4 | Bridgerton: Season 1 | 113,300,000 |
| 5 | The Queen’s Gambit: Limited Series | 112,800,000 |
| 6 | Bridgerton: Season 3 | 105,500,000 |
| 7 | The Night Agent: Season 1 | 98,200,000 |
| 8 | Fool Me Once: Limited Series | 98,200,000 |
| 9 | Stranger Things 3 | 94,800,000 |
| 10 | Bridgerton: Season 2 | 93,800,000 |
Source: Netflix
Related Read:
Conclusion: Netflix Has 301 Million Subscribers & Growing
Netflix continues to lead the global streaming industry with 301 million subscribers. The platform has experienced consistent growth, adding nearly 41 million subscribers between Q1 and Q4 of 2024.
Financially, Netflix is thriving too, bringing in $39 billion in revenue in 2024, with Q1 2025 projections at $10.42 billion. In Q3 2024, Netflix also reached a new milestone with its highest-ever net income of $2.36 billion, surpassing previous records.
In the future, given the recent partnerships and increasing popularity, Netflix’s continued growth looks set to continue.
