Video streaming has quickly become a huge part of our everyday lives. 76% of people are now watching online TV or streaming content daily. On average, viewers spend about 1 hour and 22 minutes each day enjoying their favorite shows and movies.
When it comes to video streaming in the entertainment world, Netflix stands out as the top choice, with 36% of consumers preferring it over other subscription-based platforms.
In this article, we’ll take a closer look at the video streaming industry, including market trends, user behaviors, live streaming, and more.
Top Video Streaming Statistics
- 76% of people stream online TV every day.
- Streaming services account for 40.3% of total television usage.
- The video streaming market worldwide is estimated to have reached $108.50 billion.
- 99% of American households have subscribed to at least one streaming service.
- YouTube captures 9.9% of video streaming time, making it the most favored video streaming platform worldwide.
- With 277.65 million subscribers, Netflix is the most subscribed SVOD platform worldwide.
- The livestream video gaming market is anticipated to have 1.3 billion users by the end of 2024.
Current State Of Video Streaming
- Streaming is a daily habit for 76% of consumers who watch online TV or streaming content every day.
- Paid subscriptions remain popular, with 26% of consumers saying they have subscribed to a TV streaming service in the past month.
- Weekly episode releases appeal to some viewers, as 19% of U.S. TV watchers prefer streaming a series with scheduled weekly releases rather than binge-watching entire seasons.
- Cost is a major factor in streaming bundle adoption, with 49% of consumers saying they would sign up if it were cheaper than paying for individual subscriptions.
- High-quality content is a strong motivator, as 40% of consumers say they would subscribe to a streaming bundle if it offers premium shows and movies.
- Ad-free viewing is another key incentive, with 33% of consumers willing to sign up for a bundle to avoid interruptions.
- Gen Z and millennials show the highest interest in streaming bundles, with 60% expressing a preference for bundled options.
- Gen X and baby boomers have lower interest in streaming bundles, with 50% and 35% interest levels, respectively.
- Live sports access is a strong driver for older audiences, as baby boomers (9% more than average) and Gen X (6% more) are more likely to subscribe to a bundle if it includes live sports events.
- Most viewers tolerate ads without changing their subscription, with 63% of streaming users saying they have kept their plan despite encountering ads.
- Some viewers are willing to pay more to avoid ads, with 11% upgrading to an ad-free plan for a better viewing experience.
Source: GWI
How Much Time Do People Spend On Streaming?
On average, people spend 1 hour and 22 minutes per day streaming TV shows and movies online.
This is 10 minutes less than the peak in 2022, indicating a slight dip in daily viewing time.
However, streaming habits vary across regions. Saudi Arabia, South Africa, and Egypt have the highest daily streaming times, with viewers spending an average of 1 hour and 52 minutes per day.
On the other hand, Japan and South Korea see much lower engagement, with people streaming for just 20 minutes and 44 minutes daily, respectively.
Source: GWI
Video Streaming Users
The video Streaming market is anticipated to have 1.4 billion users.
Comparatively, the industry had 1.3 billion users in 2023. That shows an estimated increase of 0.1 billion SVOD market users in 2024.
Further, the SVOD market users are anticipated to reach 1.6 billion users by 2027.
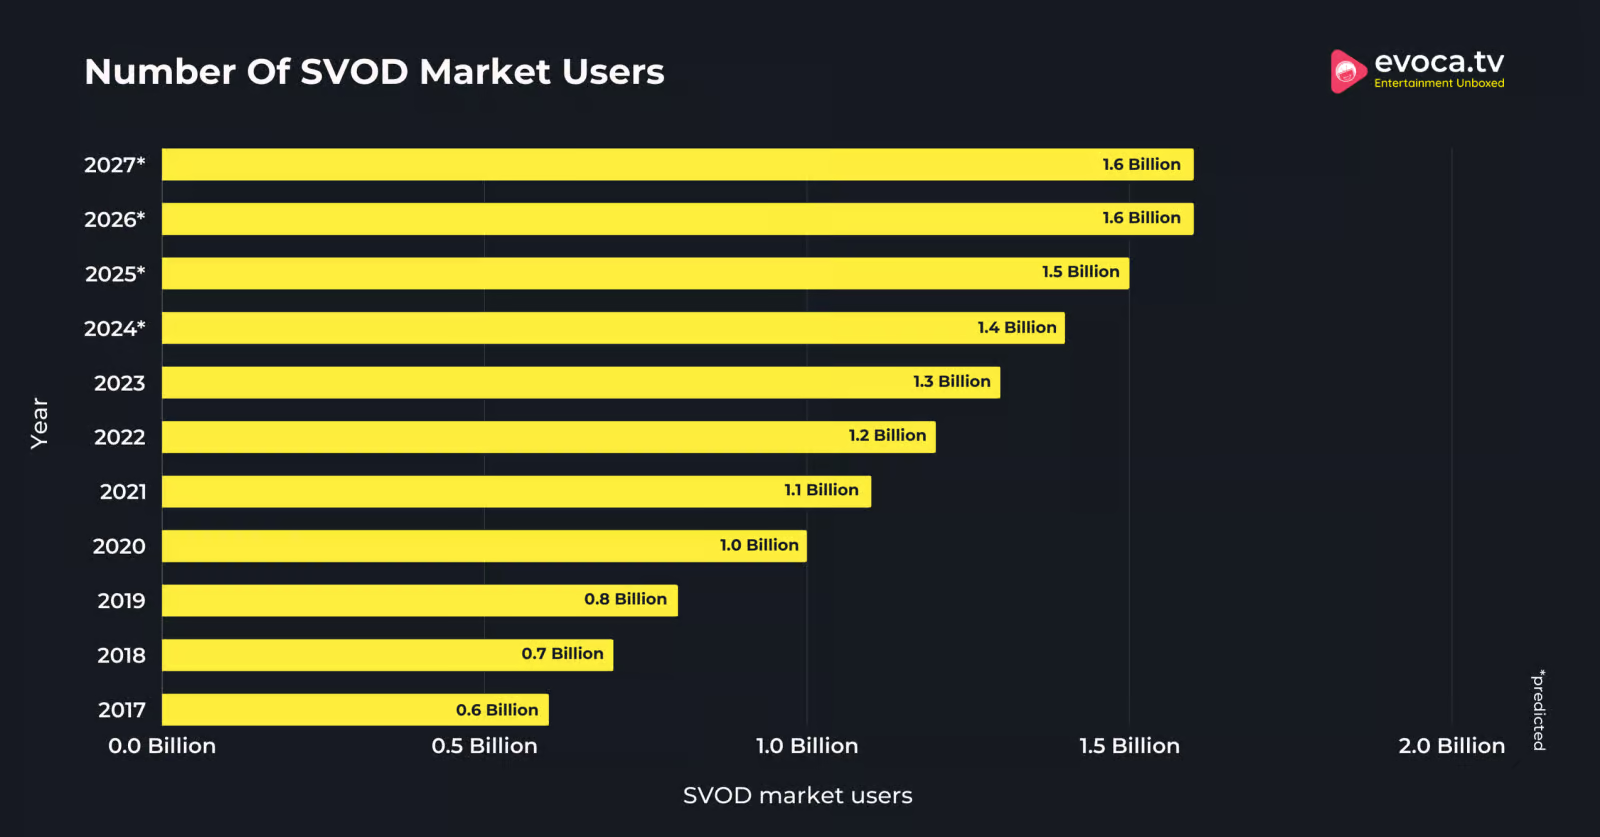
Here is a table displaying the number of SVOD market users over the years.
| Year | SVOD Market Users |
|---|---|
| 2027* | 1.6 billion |
| 2026* | 1.6 billion |
| 2025* | 1.5 billion |
| 2024* | 1.4 billion |
| 2023 | 1.3 billion |
| 2022 | 1.2 billion |
| 2021 | 1.1 billion |
| 2020 | 1.0 billion |
| 2019 | 0.8 billion |
| 2018 | 0.7 billion |
| 2017 | 0.6 billion |
Source: Statista.
99% of American households have subscribed to at least one streaming service.
72% of Americans stated that they are happy with their streaming experience, and 93% stated that they are planning to keep or increase their media streaming options.
Source: Forbes.
Americans dedicate an average of 3 hours and 9 minutes each day to streaming video content.
This amounts to over 21 hours per week spent enjoying various video streaming services.
Source: Forbes
Top Video Streaming Services
Of the 40.3% of people who prefer streaming services, 9.9% of their video streaming time is spent on YouTube, making it the most preferred video streaming platform globally.
At the same time, 8.4% of video streaming time is spent on Netflix making it the second most popular video streaming platform worldwide.
Amazon Prime Videos, Hulu, and Disney Plus are other popular video streaming platforms worldwide.
The table below shows how video streaming time is distributed within the 40.3% share of time spent on streaming services.
| Video Streaming Services | Share of Video Streaming Market |
|---|---|
| YouTube | 9.9% |
| Netflix | 8.4% |
| Prime Video | 3.1% |
| Hulu | 3.0% |
| Disney Plus | 2.0% |
| Tubi | 2.0% |
| Roku Channel | 1.5% |
| Max | 1.4% |
| Peacock | 1.2% |
| Paramount Plus | 1.1% |
| Pluto | 0.8% |
| Other Streaming services | 6.0% |
Source: Neilsen
Most Popular Video Streaming Services In The US
Amazon Prime leads as the most popular video streaming service in the U.S., capturing 22% of the SVOD market share.
At the same time, Netflix is also one of the most preferred video streaming platforms, with a market share of 22%
Other top video streaming platforms in the United States are Max, Disney Plus, and Hulu.
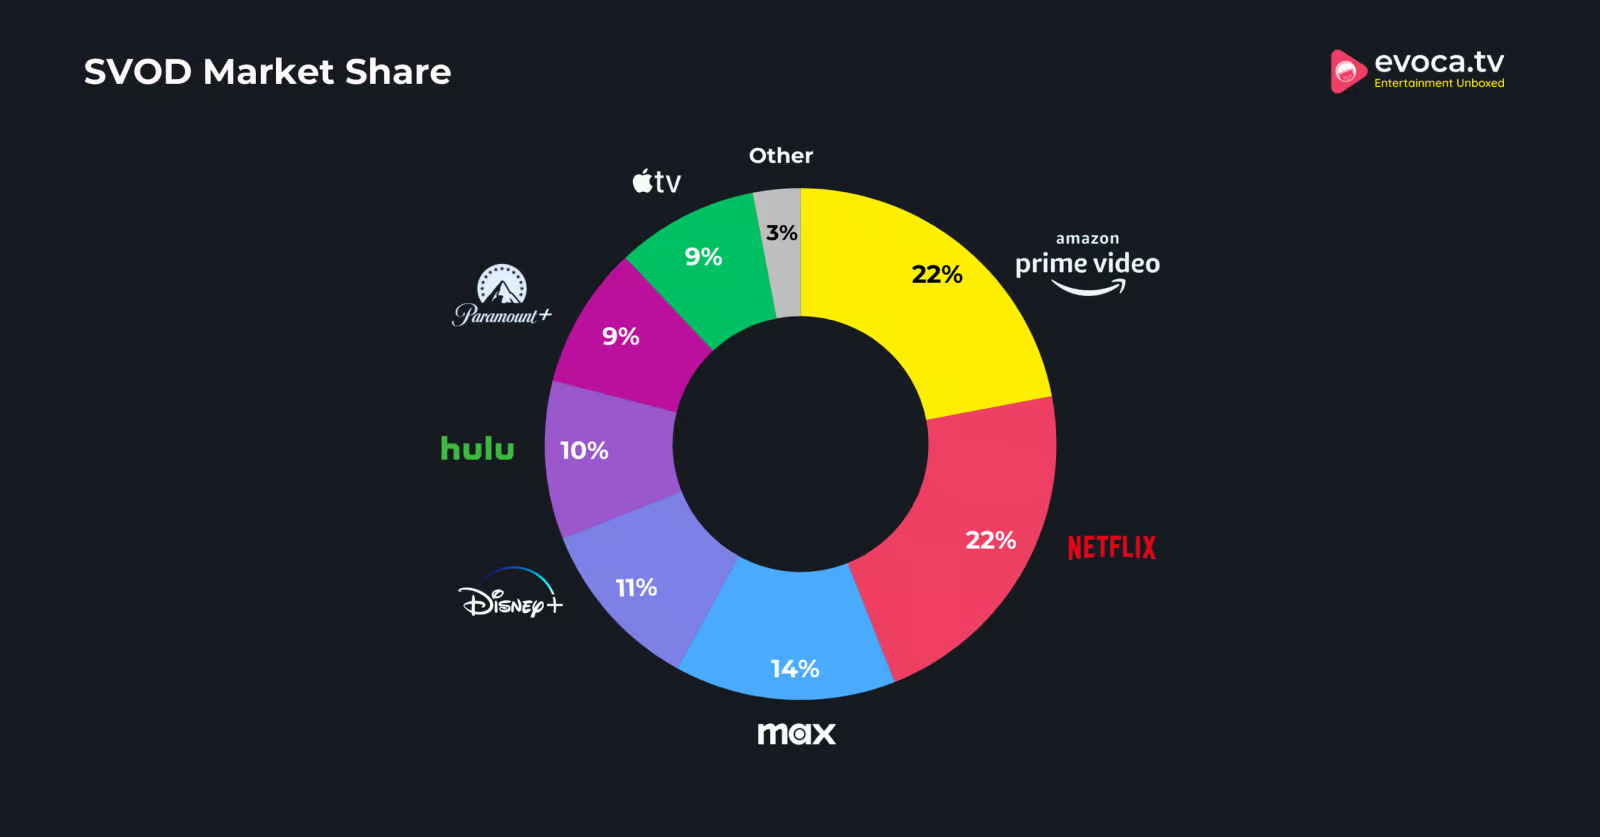
Here is a table displaying the distribution of the SVOD market share.
| SVOD Platform | Market Share of the Platform |
|---|---|
| Amazon Prime Video | 22% |
| Netflix | 22% |
| Max | 14% |
| Disney+ | 11% |
| Hulu | 10% |
| Paramount+ | 9% |
| Apple TV+ | 9% |
| Other | 3% |
Source: Statista.
Streaming Services By Subscribers
With 277.65 million subscribers globally, Netflix stands as the most popular streaming service in the world.
Meanwhile, Amazon Prime ranks as the second most subscribed video streaming platform globally, boasting 230 million subscribers, while Disney+ holds the third position with 153.8 million subscribers.
Tencent Videos, iQYI, and HBO Max are also among the most subscribed subscription video-on-demand (SVOD) platforms worldwide.
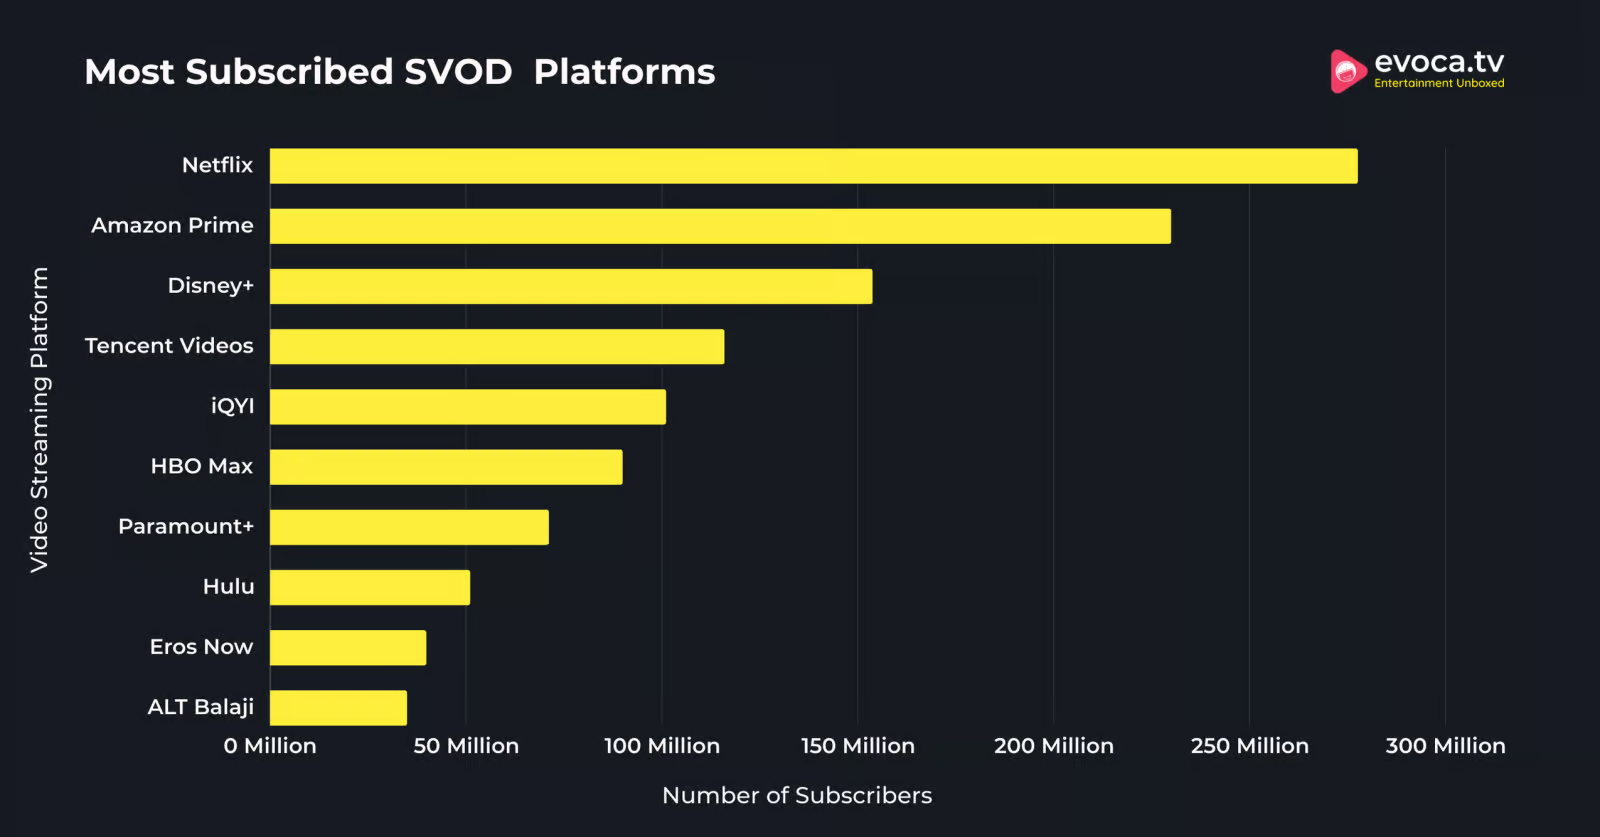
Here is a table displaying the most subscribed SVOD platforms Worldwide.
| Video Streaming Platform | Number of Subscribers |
|---|---|
| Netflix | 277.65 million |
| Amazon Prime | 230.0 million |
| Disney+ | 153.8 million |
| Tencent Videos | 116.0 million |
| iQYI | 101.1 million |
| HBO Max | 90.0 million |
| Paramount+ | 71.2 million |
| Hulu | 51.1 million |
| Eros Now | 39.9 million |
| ALT Balaji | 35.0 million |
Source: FlixPatrol
Streaming Services Market Share
Video streaming has become the most popular format for consuming videos, with 40.3% preferring it.
At the same time, 27.2% of the people preferred a cable connection for consuming videos, and 20.5% stated that they preferred video broadcasts.
Further, 12.0% of people worldwide preferred other video consumption methods.
Here is a table displaying the market share of different video consumption methods recorded over the months.
| Month Year | Streaming | Cable | Broadcast | Other |
|---|---|---|---|---|
| Jul 2023 | 38.7% | 29.6% | 20% | 11.6% |
| Aug 2023 | 38.3% | 30.2% | 20.4% | 11.1% |
| Sep 2023 | 37.5% | 29.8% | 23% | 9.6% |
| Oct 2023 | 36.6% | 29.5% | 24.6% | 9.3% |
| Nov 2023 | 36.1% | 28.3% | 24.9% | 10.7% |
| Dec 2023 | 35.9% | 28.2% | 23.5% | 12.5% |
| Jan 2024 | 36% | 27.9% | 24.2% | 11.8% |
| February 2024 | 37.7% | 27.6% | 23.3% | 11.3% |
| March 2024 | 38.5% | 28.3% | 22.5% | 10.7% |
| April 2024 | 38.4% | 29.1% | 22.2% | 10.4% |
| May 2024 | 38.8% | 28.2% | 22.3% | 10.8% |
| June 2024 | 40.3% | 27.2% | 20.5% | 12.0% |
Source: Neilsen
Video Streaming Revenue
The video streaming market worldwide is estimated to have reached $108.50 billion.
Further, the market is projected to grow at a CAGR of 8.27% from 2024 to 2027. As a result, the market size of the video streaming industry is estimated to reach $137.70 billion in 2027.
Besides, in 2023, the video streaming market was valued at $95.88 billion in 2023.
Here is a table displaying the revenue generated by the video streaming market over the years.
| Year | Video Streaming Market Revenue | Market Growth Rate |
|---|---|---|
| 2027* | 137.70 billion | 6.9% |
| 2026* | 128.80 billion | 8.2% |
| 2025* | 119.10 billion | 9.8% |
| 2024* | 108.50 billion | 13.2% |
| 2023 | 95.88 billion | 18.0% |
| 2022 | 81.26 billion | 10.0% |
| 2021 | 73.86 billion | 24.3% |
| 2020 | 59.40 billion | 34.5% |
| 2019 | 44.16 billion | 27.4% |
| 2018 | 34.65 billion | 24.4% |
| 2017 | 27.86 billion | – |
Source: Statista
The average revenue per user in the video streaming market is estimated to be $76.58 in 2024.
Comparatively, the market’s ARPU was recorded to be $73.51 in 2024, an increase of around $3 between 2023 and 2024.
Further, the average revenue per user in the video streaming market is anticipated to reach $83.69 by 2027.
Here is a table displaying the average revenue per user in the video streaming market recorded over the years.
| Year | Average Revenue Per User Of The Video Streaming Market |
|---|---|
| 2027* | $83.69 |
| 2026* | $81.33 |
| 2025* | $78.97 |
| 2024* | $76.58 |
| 2023 | $73.51 |
| 2022 | $69.61 |
| 2021 | $65.13 |
| 2020 | $60.21 |
| 2019 | $54.86 |
| 2018 | $49.64 |
| 2017 | $45.03 |
Source: Statista.
Video Streaming Consumer Behavior
45% of video streaming consumers canceled their service subscriptions in 2023 because the costs were unaffordable.
Nearly 9 in 10 consumers stated that they had canceled their streaming services subscription in the past year. Besides, 44% of the consumers stated that they have canceled their subscriptions as their service providers have raised the cost of streaming subscriptions in the past 12 months.
These numbers suggest that the costs of streaming services are important factors that consumers consider in decision-making.
Source: Forbes.
Streaming households in the United States spend $61 on average.
On average, Americans pay for 4 video streaming services.
That’s an increase from $48 per month to around 2.5 streaming services used in streaming households in the United States.
This hike is due to the increased prices of streaming services and the cord-cutting in households.
Source: IndieWire.
8 in 10 video streaming consumers stated that ease of use is a major factor that makes a platform a good streaming service.
At the same time, 84% of the consumers stated that the cost makes a platform a good streaming service.
On the other hand, just 37% of the consumers stated that the content available live makes a platform a good streaming service.
Here is a table displaying the video streaming qualities that make a platform a good streaming service according to consumers.
| Video Streaming Quality | Percentage of Consumers |
|---|---|
| Accessibility/search of desired content | 71% |
| Ad-free | 48% |
| Availability across devices | 58% |
| Content available for downloading/offline | 40% |
| Content available live | 37% |
| Cost | 84% |
| Ease of use | 81% |
| Menu Recommendations | 38% |
| Resolution available (4k Ultra HD, HD) | 56% |
| Skipping ads features | 52% |
| Speed (menu selection, loading content) | 74% |
| Streaming/playback quality | 77% |
| Variety/availability of content | 79% |
Source: Exploding topics.
2 in 10 video streaming consumers stated that they binge-watched video streaming several times per year.
On the other side, 19% of the consumers stated that they binge-watched video streaming almost every day.
Meanwhile, over one-fourth of the people stated that they preferred to binge-watch content at least once a week.
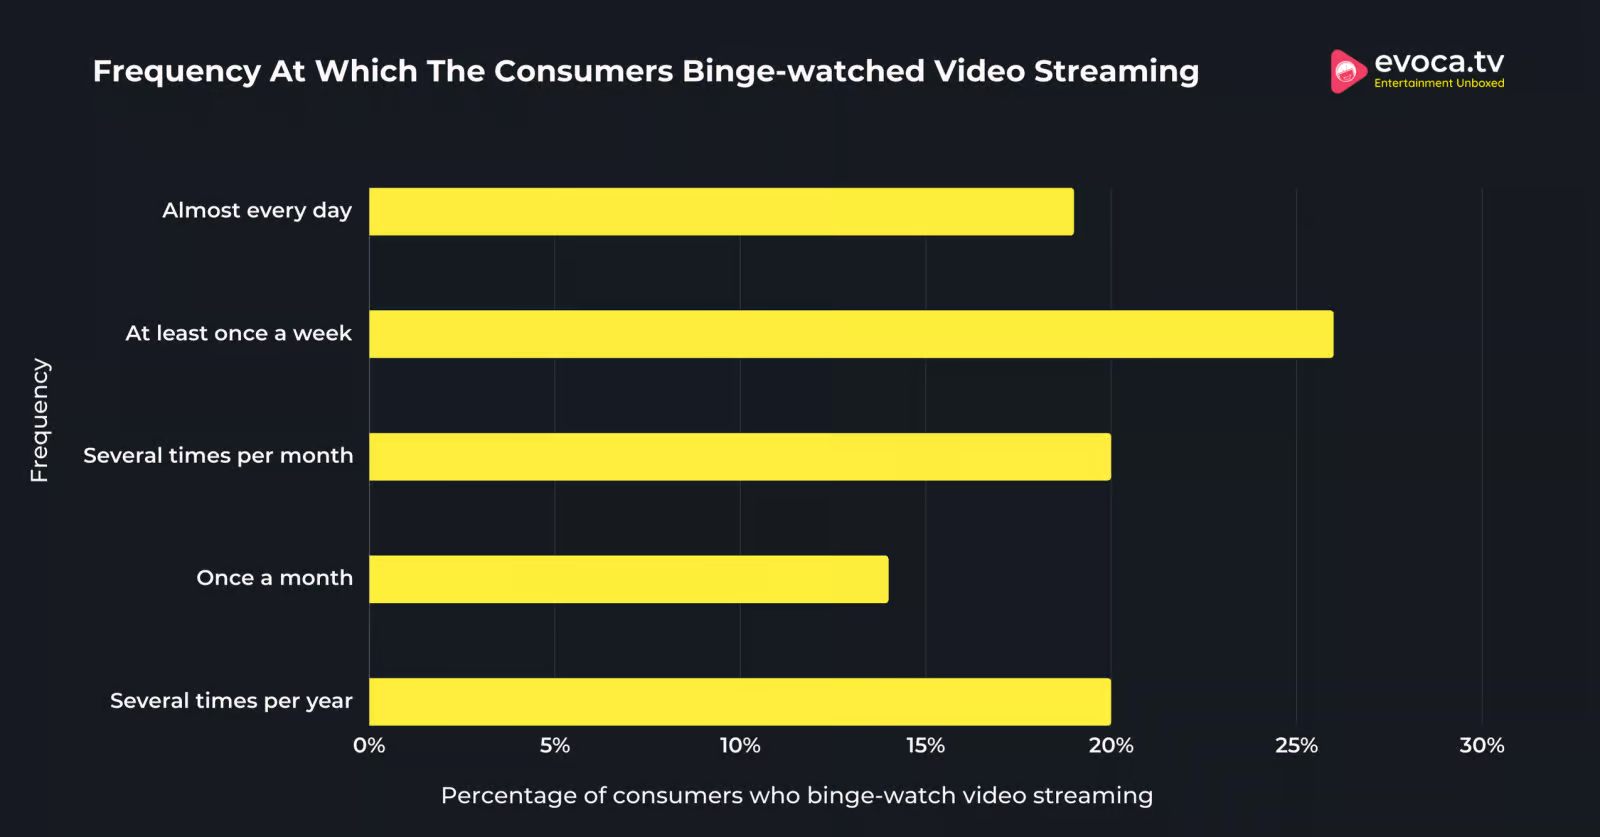
Here is a table displaying the frequency at which the consumers binge-watched video streaming.
| Frequency | Percentage Of Consumers Who Binge-watch Video Streaming |
|---|---|
| Almost every day | 19% |
| At least once a week | 26% |
| Several times per month | 20% |
| Once a month | 14% |
| Several times per year | 20% |
Source: Exploding topics.
36% of the people stated that Netflix is the best streaming service.
Netflix is the video streaming platform that is preferred by the majority of people worldwide.
Over a third of the streaming users stated that Netflix is their favorite platform. At the same time, 14% of the people stated that Amazon Prime Video is their favorite streaming platform.
Other streaming platforms preferred by the streamers are ESPN+, Disney+, and HBO Max.
Here are further details about the most popular streaming services based on the user experience.
| Video Streaming Services | Percentage of Streamers |
|---|---|
| Netflix | 36% |
| Amazon Prime Video | 14% |
| ESPN+ | 11% |
| Disney+ | 9% |
| HBO Max | 7% |
| Others | 23% |
Source: Forbes.
Video Game Streaming Statistics
The video game live-streaming market was forecasted to have reached $13.65 billion.
Further, the revenue is anticipated to grow at a CAGR of 6.17% between 2024 and 2029 and is predicted to reach $18.41 billion in 2029.
Besides, the video game live-streaming market was recorded to be valued at $11.69 billion in 2023.
Here is a table displaying the video game live-streaming market over the years:
| Year | Video Game Live-streaming Market Revenue | Market Growth Rate |
|---|---|---|
| 2029* | 18.41 billion | 2.9% |
| 2028* | 17.90 billion | 2.9% |
| 2027* | 17.39 billion | 5.0% |
| 2026* | 16.56 billion | 8.1% |
| 2025* | 15.32 billion | 12.2% |
| 2024* | 13.65 billion | 16.7% |
| 2023 | 11.69 billion | 20.1% |
| 2022 | 9.74 billion | 21.1% |
| 2021 | 8.05 billion | 19.4% |
| 2020 | 6.74 billion | 16.1% |
| 2019 | 5.80 billion | 12.3% |
| 2018 | 5.17 billion | 8.8% |
| 2017 | 4.75 billion | – |
Source: Statista.
The number of livestream gaming users was anticipated to reach 1.3 billion.
Comparatively, the number of live-streaming users was recorded to be 1.1 billion in 2023. Further, by the end of 2029, this number is anticipated to reach 1.8.
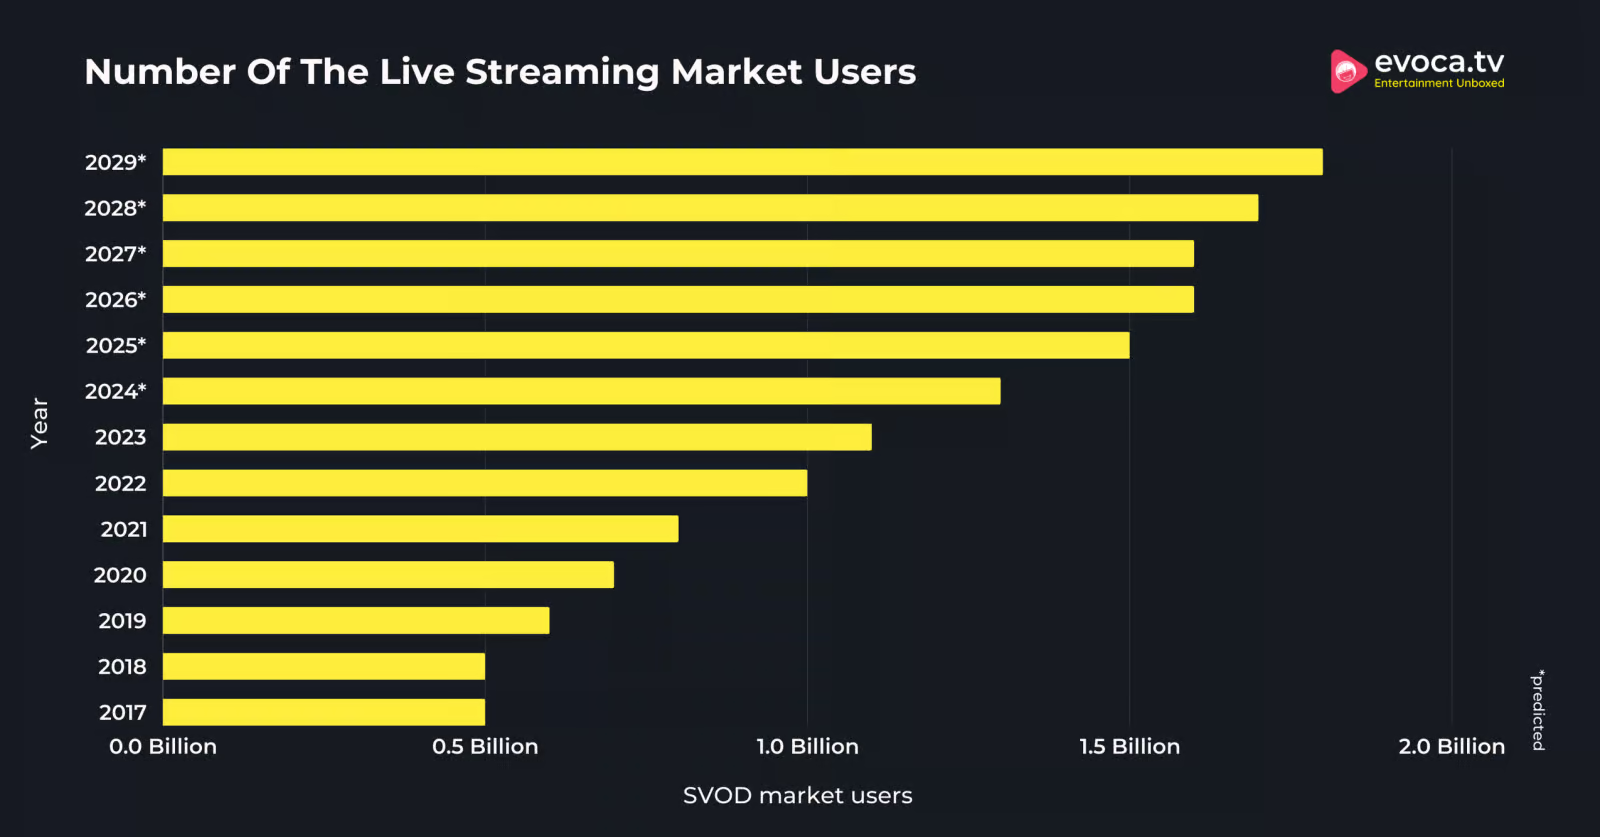
Here is a table displaying the number of the live streaming market users over the years.
| Year | Number of Live Stream Gaming Market Users |
|---|---|
| 2029* | 1.8 billion |
| 2028* | 1.7 billion |
| 2027* | 1.6 billion |
| 2026* | 1.6 billion |
| 2025* | 1.5 billion |
| 2024* | 1.3 billion |
| 2023 | 1.1 billion |
| 2022 | 1.0 billion |
| 2021 | 0.8 billion |
| 2020 | 0.7 billion |
| 2019 | 0.6 billion |
| 2018 | 0.5 billion |
| 2017 | 0.5 billion |
Source: Statista.
Video Live Streaming Statistics
In the last quarter of the year 2023, 28.5% of internet users watched live streaming weekly.
This share is similar to the percentage of internet users who watched livestream weekly in the last quarter of 2022.
Comparatively, in the third quarter of 2023, 27.7% of internet users watched live streams weekly.
Here is a table displaying the share of internet users who watch live streams weekly recorded over the quarters.
| Quarter Year | Percentage of Internet Users |
|---|---|
| Q4 2023 | 28.5% |
| Q3 2023 | 27.7% |
| Q2 2023 | 27.6% |
| Q1 2023 | 27.4% |
| Q4 2022 | 28.5% |
| Q3 2022 | 29.7% |
| Q2 2022 | 29.5% |
| Q4 2021 | 29.5% |
| Q3 2021 | 30.4% |
| Q2 2021 | 30.1% |
Source: Statista.
More Stats Like This:
Conclusion: 1.4 Billion People Are Estimated To Use Video Streaming!
With 76% of people watching streaming content every day and spending an average of 1 hour and 22 minutes doing so, it’s clear that online platforms are here to stay. Services like Netflix are leading the way, with 36% of users choosing it over others.
Looking ahead, despite the challenges in the industry, the video streaming market is expected to grow significantly, particularly in gaming, entertainment, and live streaming. By the end of 2027, the number of video streaming users worldwide is projected to reach 1.6 billion.
